2009 Jan ~ July Sale Growth Analysis of Higer
23 September 2009
1、Sale growth analysis on every length bus
|
|
Total
|
12<L
|
11<L≤12
|
10<L≤11
|
9<L≤10
|
8<L≤9
|
7<L≤8
|
6<L≤7
|
|
2009 Jan~Aug
|
8894
|
41
|
1127
|
487
|
2057
|
1462
|
2217
|
1503
|
|
2008 Jan~Aug
|
11233
|
4
|
968
|
891
|
1913
|
2255
|
3127
|
2075
|
|
Growth Y/Y
|
-20.8
|
925
|
16.4
|
-45.3
|
7.5
|
-35.2
|
-29.1
|
-26.9
|
|
Industry Growth
|
-21.3
|
-56.8
|
-29.8
|
-20.9
|
-19.4
|
-19.0
|
-28.3
|
-5.3
|
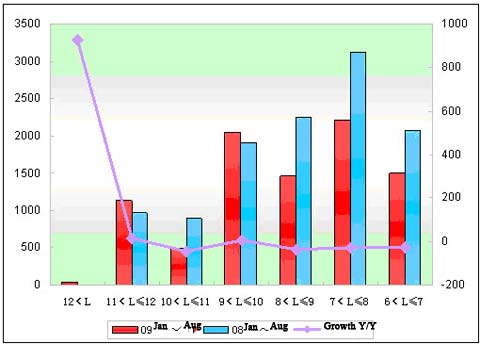
①Higer sale volume in Jan~Aug decline 20.8%,increase rate is higher 0.5 percentage than the industry, extra large bus increase more than 9 times, 11~12m increase 16.4%, 9~10m bus is upward, indicate the product structure is relative reasonable,It’s excellent when industry are all in decline trend.
②Extra large bus sold 41 units,increase 37 units comparing with the same period of last year, this is a break of Higer in extra lager bus field.
2、Higer public bus
|
|
Total
|
11<L≤12
|
10<L≤11
|
9<L≤10
|
8<L≤9
|
7<L≤8
|
|
2009 Jan~Aug
|
1992
|
165
|
151
|
1138
|
387
|
151
|
|
2008 Jan~Aug
|
2330
|
180
|
530
|
945
|
675
|
0
|
|
Growth Y/Y
|
-14.5
|
-8.3
|
-71.5
|
20.4
|
-42.7
|
100
|
|
Industry Growth
|
-23.9
|
-40.0
|
-9.7
|
-9.3
|
-21.7
|
-34.2
|
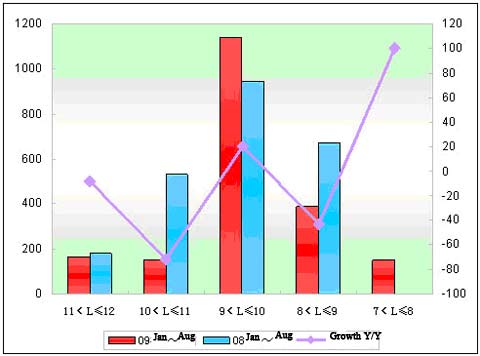
①The sale volume of Higer bus in Jan~Aug is 1992, decline 338 units, ratio up to -14.5% comparing to the same period of last year. It’s higher nearly 8.5 percentage than the industry.
②The growth of Higer public bus mainly concentrate in 7~8m, increase 151 units, 9~10m are positive growth while other length are all negative growth.
③The decline ratio of Higer is lower than the industry in Jan~Aug, the low negative growth of public bus is the main reason of preventing the whole decline of Higer.
Source : www.english.chinabuses.com
Editor : shelly
Views:2807
Share :