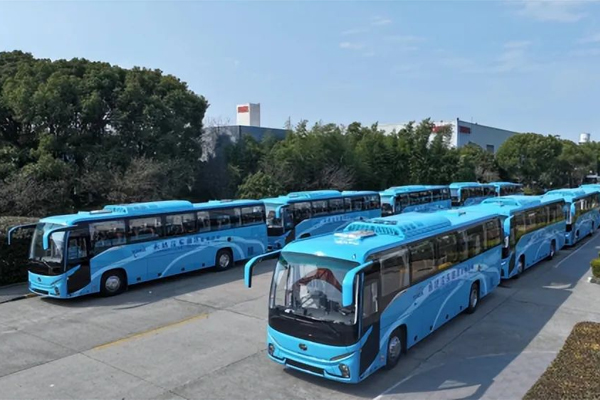
2009 Jan ~ July Chongqing Hengtong Sale Data Analysis II
17 September 2009
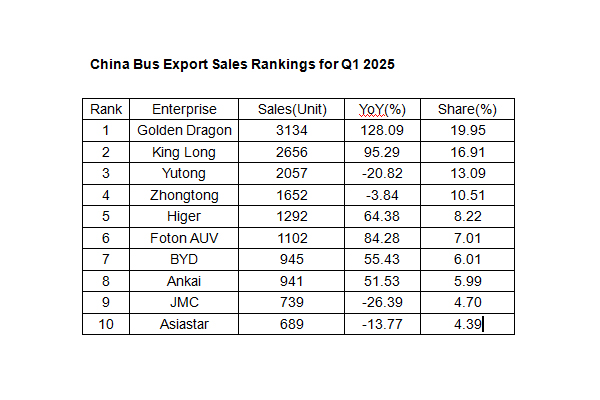
1、09 Jan ~ July bus industry sale volume top 20 rank analysis
|
Rank
|
Enterprise
|
09 Jan~July
|
08 Jan~July
|
Growth Y/Y
|
|
1
|
Yutong
|
13014
|
16989
|
-23.40
|
|
2
|
Golden Dragon
|
7434
|
10265
|
-27.55
|
|
3
|
Higer
|
7258
|
10030
|
-27.64
|
|
4
|
Kinglong
|
6732
|
8654
|
-22.21
|
|
5
|
Shaolin
|
3639
|
4475
|
-18.68
|
|
6
|
Zhongtong
|
3415
|
4701
|
-27.36
|
|
7
|
Hengtong
|
2332
|
2226
|
4.76
|
|
8
|
FAW
|
2242
|
1802
|
24.42
|
|
9
|
Changan
|
2013
|
2308
|
-12.78
|
|
10
|
Youyi
|
1986
|
2663
|
-25.42
|
|
11
|
JAC
|
1866
|
3525
|
-47.06
|
|
12
|
Yangtse
|
1560
|
1916
|
-18.58
|
|
13
|
Guilin
|
1472
|
1475
|
-0.20
|
|
14
|
Shenlong
|
1410
|
1776
|
-20.61
|
|
15
|
Foton
|
1281
|
1472
|
-12.98
|
|
16
|
Iveco
|
1274
|
1841
|
-30.80
|
|
17
|
Huanghai
|
1254
|
3013
|
-58.38
|
|
18
|
Sunwin
|
1185
|
2023
|
-41.42
|
|
19
|
Neoplan
|
1153
|
1194
|
-3.43
|
|
20
|
Ankai
|
1140
|
1928
|
-40.87
|
|
|
Industry
|
74279
|
103206
|
-28.03
|
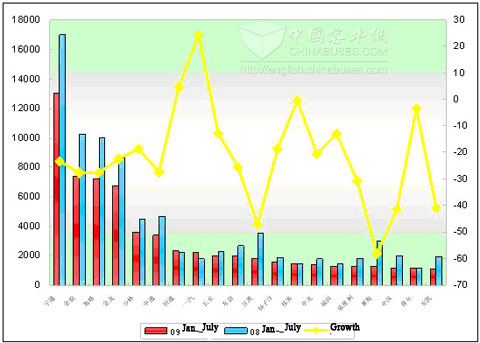
1、The top 20 mainstream enterprises which positive growth are only 2, FAW and Chongqing Hengtong, the other 18 ones are all negative growth.
2、The industry average growth extent is -28.03%, the second-line enterprises which growth extent is over -20%:Chongqing Hengtong、Guilin Bus、Zhejiang Youngman、Baoding Changan、Foton、Shaolin Bus and Zhongtong Bus etc. these enterprises make an active effect to stop the decline of bus industry in Jan ~ July.
2、Chongqing Hengtong sale growth analysis
|
|
Total
|
12<L
|
11<L≤12
|
10<L≤11
|
9<L≤10
|
8<L≤9
|
7<L≤8
|
6<L≤7
|
5<L≤6
|
|
2009 Jan~July
|
2332
|
92
|
66
|
1054
|
321
|
408
|
182
|
134
|
75
|
|
2008
Jan~July |
2226
|
0
|
234
|
815
|
453
|
220
|
101
|
35
|
368
|
|
Growth Y/Y
|
4.76
|
100
|
-71.8
|
29.33
|
-29.14
|
85.45
|
80.2
|
282.86
|
-79.62
|
|
Industry Growth Y/Y
|
-28.03
|
-62.34
|
-35.05
|
-25.32
|
-27.08
|
-23.21
|
-34.2
|
-16.56
|
-21.57
|
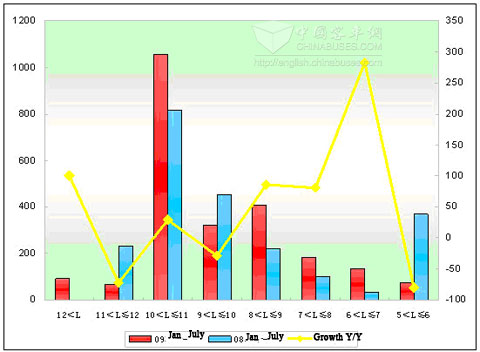
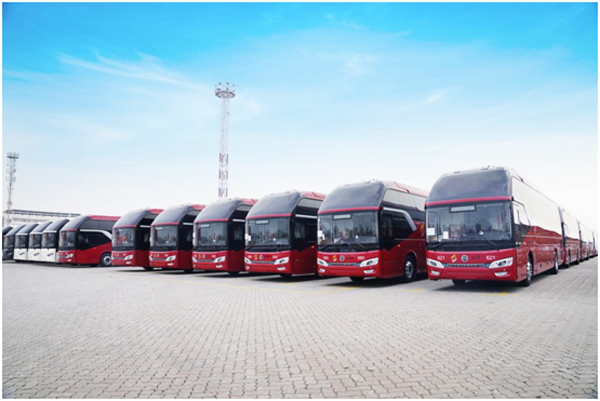
①The sale volume of Hengtong bus in Jan~July of 2009 increase 4.76% comparing to the same period of last year. It’s excellent when industry are all in decline trend, especially the extra large bus grow 92 units while the last year was zero.
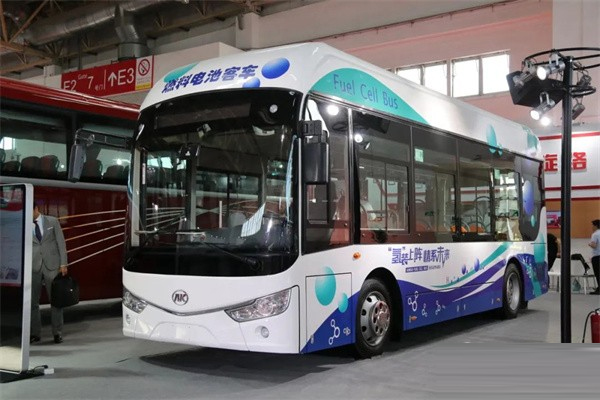
③Hengtong bus as the top 1 enterprise in CNG public bus industry, which 10~11M bus take 45.2% of product construction,lay the 1st in industry.
Source : www.english.chinabuses.com
Editor : shelly
Views:3794
Share :