2009 Jan ~ July Sale Growth Analysis of Xiamen Golden Dragon
11 September 2009
Sale growth analysis on every length bus
|
|
Total
|
11<L≤12
|
10<L≤11
|
9<L≤10
|
8<L≤9
|
7<L≤8
|
6<L≤7
|
5<L≤6
|
3.5<L≤5
|
|
2009
Jan~July |
7434
|
719
|
360
|
189
|
814
|
282
|
883
|
315
|
3872
|
|
2008
Jan~July |
10265
|
1387
|
723
|
185
|
763
|
809
|
870
|
259
|
5269
|
|
Growth Y/Y
|
-27.6
|
-48.2
|
-50.2
|
2.2
|
6.7
|
-65.1
|
1.49
|
21.6
|
-26.5
|
|
Industry Growth
|
-28.03
|
-35.05
|
-25.32
|
-27.08
|
-23.21
|
-34.2
|
-16.56
|
-21.57
|
-25.46
|
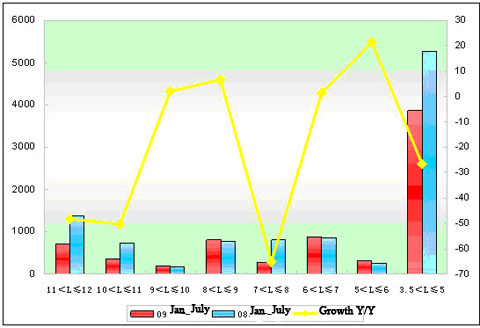
Sum up from the table: Golden Dragon Jan ~ May sale were 27.6 percent reduction, which is lower than the industry nearly 0.4 percentage points.
The product structure of Golden Dragon is not good, the large bus percentage is not too high, sale of less 8 meters vehicle accounted for 72.0%, which was disadvantage to their profits.
3、Golden Dragon public bus
|
|
Total
|
11<L≤12
|
10<L≤11
|
9<L≤10
|
8<L≤9
|
7<L≤8
|
|
2009 Jan~July
|
473
|
113
|
87
|
19
|
72
|
182
|
|
2008 Jan~July
|
1058
|
423
|
182
|
0
|
283
|
170
|
|
Growth Y/Y
|
-55.3
|
-73.3
|
-52.2
|
100
|
-74.6
|
7.1
|
|
Industry Growth
|
-30.19
|
-48.81
|
-16.84
|
-17.21
|
-22.82
|
-38.84
|

The table indicate:
②The growth length mainly concentrate in 7~8m bus,the number is 12 units,the rate is 7.1%,the small quantity is not enough to pull the growth of Golden Dragon. The other lengths are all decline, and the rate is lower than the industry.
Source : www.english.chinabuses.com
Editor : shelly
Views:3506
Share :


