Jan.-Jul. 2009 Kinglong Sales Statistics II
11 September 2009
1. Kinglong’s Sales Volume in China Bus Industry
|
|
Total |
12<L |
11<L≤12 |
10<L≤11 |
9<L≤10 |
8<L≤9 |
7<L≤8 |
5<L≤6 |
3.5<L≤5 |
|
2009 |
6732 |
6 |
2194 |
869 |
318 |
1311 |
619 |
1415 |
0 |
|
2008 |
8654 |
0 |
3715 |
690 |
479 |
1707 |
794 |
1019 |
250 |
|
Ratio
|
-22.2 |
100 |
-40.9 |
25.9 |
-33.6 |
-23.2 |
-22.0 |
38.9 |
-100 |
|
Industry Ratio |
-28.03 |
-62.34 |
-35.05 |
-25.32 |
-27.08 |
-23.21 |
-34.2 |
-21.57 |
-25.46 |
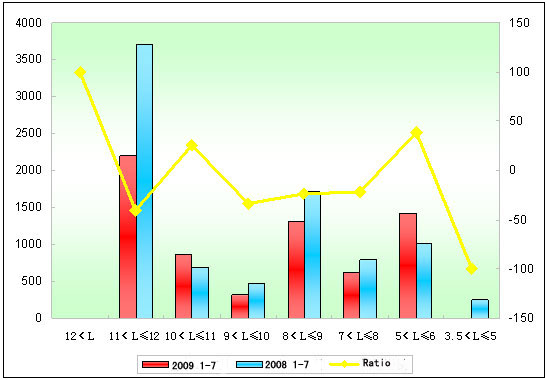
Remark: From January to July in 2009, the sales volume of Kinglong decreases 1922 units, down 22.2%. The bus length of 11~12m, 9~10m, 8~9m, 7~8m is down 40.9%, 33.6%, 23.2%, and 22%. The 11~12m bus has good performance and placing the second position.
2. Sales Volume of Kinglong Seating Bus
|
|
Total |
12<L |
11<L≤12 |
10<L≤11 |
9<L≤10 |
8<L≤9 |
7<L≤8 |
5<L≤6 |
3.5<L≤5 |
|
2009 |
4960 |
6 |
1156 |
496 |
318 |
950 |
619 |
1415 |
0 |
|
2008 |
6457 |
0 |
2027 |
393 |
479 |
1495 |
794 |
1019 |
250 |
|
Ratio |
-23.2 |
100 |
-42.97 |
26.2 |
-33.6 |
-36.5 |
-22 |
38.9 |
-100 |
|
Industry Ratio |
-27.06 |
9.54 |
-25.04 |
-36.00 |
-34.93 |
-23.65 |
-31.75 |
-16.51 |
-25.46 |
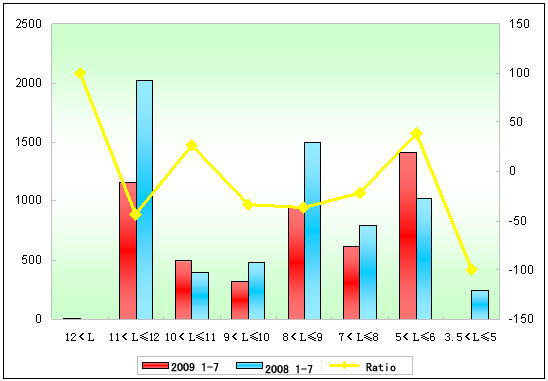
Remark: From January to July in 2009, the sales volume of Kinglong’s seating bus is down 23.2%. The length of 11~12m bus’s sale is down 42.97%. The whole sales trend is weak that reflecting the economy weakly. Especially point out that from the month of May, Kinglong sells 5 units oversize seating buses.
3. Sales Volume of Kinglong Inner City Bus
|
|
Total |
11<L≤12 |
10<L≤11 |
8<L≤9 |
|
2009 Jan~Jul |
1697 |
965 |
373 |
359 |
|
2009 Jan~Jul |
2197 |
1688 |
297 |
212 |
|
Ratio |
-22.76 |
-42.83 |
25.6 |
69.3 |
|
Industry Ratio |
-30.19 |
-48.81 |
-16.84 |
-22.82 |
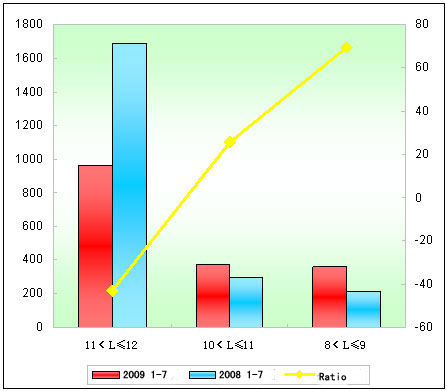
Remark: From January to July in 2009, the sales volume of Kinglong’s inner city bus is down 22.76%. The length of 11~12m bus slips sharply with 42.83%. The length of 10~11m bus is up 25.6%. The trend for the whole sale of inner city bus is down.
Source : english.chinabuses.com
Editor : Frederick
Views:3492


