2009 January Medium-bus Sale Analysis
01 April 2009
Medium-bus sales volume history show
2008 Jan to 2009 Jan Medium-bus sales volume statistic data table
|
Year
|
Month
|
9<L≤10
|
8<L≤9
|
7<L≤8
|
Total
|
|
2008
|
c
|
1103
|
2234
|
3380
|
6717
|
|
Feb
|
477
|
814
|
1484
|
2775
|
|
|
March
|
1129
|
1463
|
2511
|
5103
|
|
|
Apr
|
1242
|
1789
|
3011
|
6042
|
|
|
May
|
1239
|
2408
|
3056
|
6703
|
|
|
June
|
1858
|
3049
|
4593
|
9500
|
|
|
July
|
711
|
1068
|
1415
|
3194
|
|
|
Aug
|
695
|
1549
|
1808
|
4052
|
|
|
Sept
|
1069
|
1834
|
2129
|
5032
|
|
|
Oct
|
981
|
1300
|
1261
|
3542
|
|
|
Nov
|
798
|
1211
|
1831
|
3840
|
|
|
December
|
1574
|
2205
|
2782
|
6561
|
|
|
2009
|
Jan
|
837
|
1343
|
1641
|
3821
|
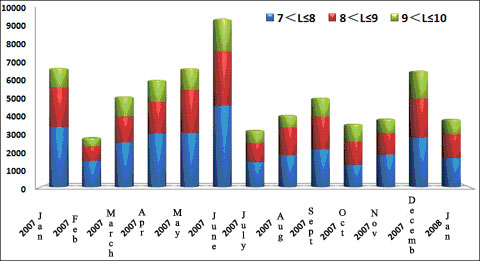
2008 Jan to 2009 Jan medium-bus sales volume statistic data chart
We have observed the above chart and found that: the overall change in medium-bus seasonal trends and fluctuations is very close to that of entire bus industry. In particular, from the second half of last year after the medium-bus of the overall sales volume is lower than the overall level of the first half, especially the7<L≤8 meter bus market shrink significantly.
Source : www.english.chinabuses.com
Editor : Shelly
Views:4509
Share :


