2009 January Mini-bus Sale Analysis(1)
24 March 2009
一、Mini-bus data analysis
2007Jan to 2009 Jan bus sales volume statistic data table
|
|
Jan
|
Feb
|
March
|
Apr
|
May
|
June
|
|
2007
|
13670
|
8808
|
10323
|
15028
|
12372
|
14498
|
|
2008
|
17124
|
6960
|
12374
|
15579
|
17003
|
23078
|
|
2009
|
9268
|
|
|
|
|
|
|
|
July
|
Aug
|
Sept
|
Oct
|
Nov
|
Decem
|
|
2007
|
12768
|
14591
|
16698
|
12077
|
14995
|
21756
|
|
2008
|
10384
|
10732
|
12435
|
9439
|
10424
|
16062
|
|
2009
|
|
|
|
|
|
|
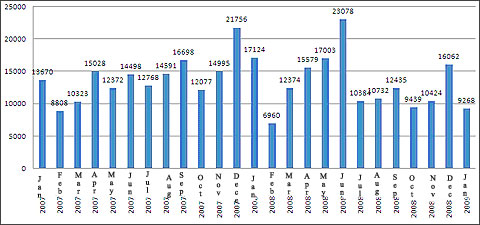
2007Jan to 2009 Jan bus sales volume statistic data chart
We conclude according to the chart :Bus industry shows seasonal fluctuations ,belong to the typical industry of volatility development.
Source : www.english.chinabuses.com
Editor : Shelly
Views:5185
Share :


