2008 Mini-bus Sales Analysis (2)
19 February 2009
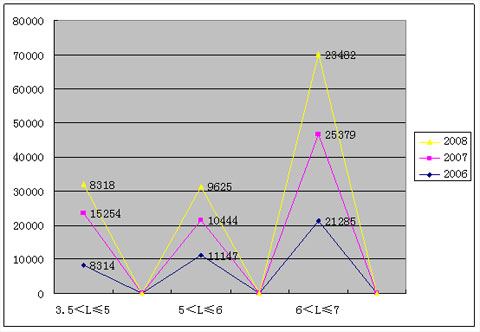
We divide minibus in accordance with the length into 3.5 <L ≤ 5 meters, 5 <L ≤ 6 m and 6 <L ≤ 7 meters, and its recently three-year performance and market share data, see the following chart below:
Mini-bus recently three-year sales table in every length
|
|
3.5<L≤5
|
5<L≤6
|
6<L≤7
|
|||
|
|
Sales
|
Growth
|
Sales
|
Growth
|
Sales
|
Growth
|
|
2006
|
8314
|
-
|
11147
|
-
|
21285
|
-
|
|
2007
|
15254
|
83.47%
|
10444
|
-6.31%
|
25379
|
19.23%
|
|
2008
|
8318
|
-45.47%
|
9625
|
-7.84%
|
23482
|
-7.47%
|
Mini-bus recently three-year sales chart in every length
Mini-bus recently three-year market shares chart in every length
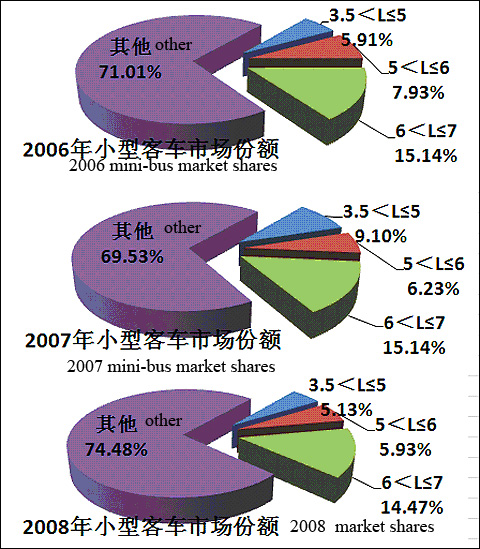
According to above tables, we found, 3.5 <L ≤ 5 meters grow 83 % in the same period of 2007, rapidly expanding its market shares to 9.1 %, but sales shrink this year, up to -45%, the share also shrink to 5.1%; 5 <L ≤ 6 meters sales steady decreased slightly, three-year market share is also decreasing year by year; 6 <L ≤ 7 meters grow 19 % in 2007, in 2008 with the macro environment influence continues to shrink, sales negative growth of 7 %, market share also drop to the current 14.5%. The overall look, the three paragraphs in length in 2008, have all experienced shrinking sales, the overall decline in the mini-bus, has become the direct cause of poor sales which affect the entire vehicle.
Source : www.english.chinabuses.com
Editor : Shelly
Views:4262
Share :


