2008 Mini-bus Sales Analysis (1)
17 February 2009
Mini- bus data analysis
First, we study the past three years sales changes of bus and mini-bus.
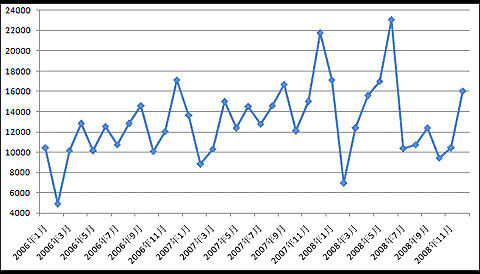
In the past three years bus and mini-bus single month sales tables
|
|
|
Jan
|
Feb
|
March
|
Apr
|
May
|
June
|
|
2006
|
Bus
|
10472
|
4893
|
10172
|
12815
|
10122
|
12563
|
|
Mini-bus
|
2677
|
1352
|
3655
|
3753
|
3203
|
4123
|
|
|
2007
|
Bus
|
13670
|
8808
|
10323
|
15028
|
12372
|
14498
|
|
Mini-bus
|
3679
|
2209
|
3428
|
4595
|
4653
|
4589
|
|
|
2008
|
Bus
|
17124
|
6960
|
12374
|
15579
|
17003
|
23078
|
|
Mini-bus
|
4447
|
2116
|
3525
|
4526
|
5085
|
6057
|
|
|
|
|
July
|
Aug
|
Sept
|
Oct
|
Nov
|
Dece
|
|
2006
|
Bus
|
10765
|
12818
|
14601
|
10087
|
12033
|
17151
|
|
Mini-bus
|
2963
|
3942
|
3994
|
3271
|
3212
|
4619
|
|
|
2007
|
Bus
|
12768
|
14591
|
16698
|
12077
|
14995
|
21756
|
|
Mini-bus
|
4017
|
4466
|
5214
|
3870
|
4503
|
5854
|
|
|
2008
|
Bus
|
10384
|
10732
|
12435
|
9439
|
10424
|
16062
|
|
Mini-bus
|
1931
|
2320
|
2546
|
2508
|
2594
|
3770
|
Over the past three years, single month sales data of bus
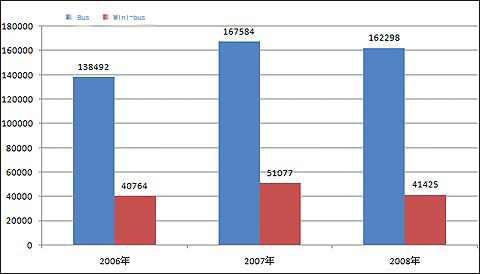
In the past three years bus and mini-bus sales growth statistics
|
|
Bus
|
mini-Bus
|
||
|
|
Sales
|
Growth
|
Sales
|
Growth
|
|
2006年
|
138492
|
19.71%
|
40764
|
19.81%
|
|
2007年
|
167584
|
21.01%
|
51077
|
25.30%
|
|
2008年
|
162298
|
-3.15%
|
41425
|
-18.90%
|
Over the past three years, sales of bus and mini-bus charts
Source : www.english.chinabuses.com
Editor : Shelly
Views:4140
Share :


