Brief Analysis of Exporting and Importing of Commercial Vehicles in July 2011
19 September 2011
Export:
Sales Table of Exporting of Commercial Vehicles:
|
|
Sales Volume (unit) |
Month-on-month Growth (%) |
Year-on-year Growth (%) |
Sales Amount (USD) |
Year-on-year Growth (%) |
|
July 2011 |
39000 |
32.14 |
50.66 |
720,000,000.00 |
68.76 |
|
main exporting countries |
Algeria, Brazil, Iran, Saudi Arabia, Syria, Vietnam, Russia, Peru, Columbia, Chile, South Africa, Mongolia, Burma and Kazakhstan. |
||||
|
Jan.-July 2011 |
212100 |
__________ |
32.73 |
3,931,000,000.00 |
41.25 |
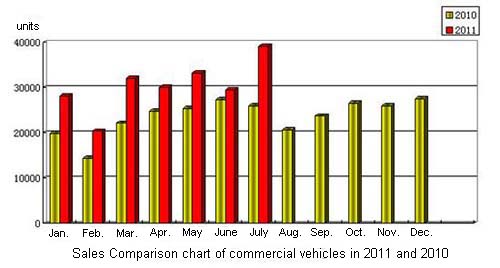
Sales Comparison Chart of Commercial Vehicles in 2011 and 2010
Sales Table of Exporting of Trucks:
|
|
Sales Volume (unit) |
Month-on-month Growth (%) |
Year-on-year Growth (%) |
Sales Amount (USD) |
Year-on-year Growth (%) |
|
July 2011 |
33400 |
29.05 |
61.39 |
434,000,000.00 |
71.32 |
|
Jan.-July 2011 |
182800 |
__________ |
41.54 |
2,525, 000,000.00 |
48.01 |
Import:
Sales Table of Importing of Commercial Vehicles:
|
|
Sales Volume (unit) |
Month-on-month Growth (%) |
Year-on-year Growth (%) |
|
July 2011 |
2900 |
11.08 |
16.34 |
|
main exporting countries |
|
||
|
Jan.-July 2011 |
15300 |
__________ |
30.83 |
Source : www.chinabuses.org
Editor : Andrea
Views:4768