2009 Jan ~ Aug Higer Sale Data Analysis
28 September 2009
2009 Jan ~ Aug sale growth data analysis of bus industry comparing with the same period of 2008
1、The sale growth analysis of all the buses in every length
|
|
Total
|
12<L
|
11<L≤12
|
10<L≤11
|
9<L≤10
|
8<L≤9
|
7<L≤8
|
6<L≤7
|
5<L≤6
|
3.5<L≤5
|
|
2009
Jan~Aug |
89636
|
1140
|
15119
|
12401
|
6815
|
11648
|
15246
|
15890
|
6236
|
5141
|
|
2008
Jan~Aug |
113938
|
2638
|
21534
|
15673
|
8454
|
14374
|
21258
|
16776
|
6979
|
6252
|
|
Growth Y/Y
|
-21.3
|
-56.8
|
-29.8
|
-20.9
|
-19.4
|
-19.0
|
-28.3
|
-5.3
|
-10.6
|
-17.8
|
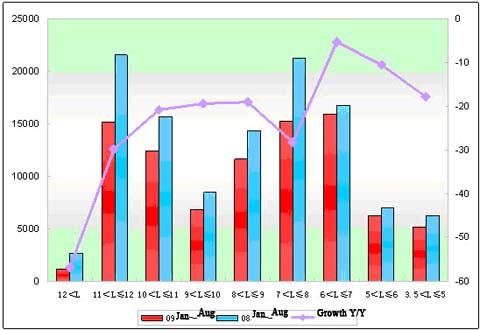
The table indicate:Jan ~ Aug ,2009 sale decline 21.3% comparing with the same period of last year,in the terms of length, no one is increase, which is the 8th month decline after Jan of 2009,all above show that the impact of financial crisis on market is continuous, bus the decline has reduced compared with the previous months trend, the getting-warm evidence has appeared.
2、Public bus
|
|
Total
|
12<L
|
11<L≤12
|
10<L≤11
|
9<L≤10
|
8<L≤9
|
7<L≤8
|
6<L≤7
|
5<L≤6
|
|
2009
Jan~Aug |
29896
|
529
|
5977
|
7662
|
3970
|
4995
|
4340
|
2161
|
235
|
|
2008
Jan~Aug |
39290
|
2160
|
9965
|
8482
|
4376
|
6376
|
6599
|
682
|
650
|
|
Growth Y/Y
|
-23.9
|
-75.5
|
-40.0
|
-9.7
|
-9.3
|
-21.7
|
-34.2
|
216.9
|
-63.8
|
09 Jan~Aug public bus decreased 23.9%,which is the 7th month decline since last year, all above show that the impact of financial crisis on market is continuous, is also the main reason of bus market’s decline in Jan ~ Aug of 2009. In the terms of length, only 6~7M bus is positive growth which ratio is 216.9%.
3、Sleeper bus
|
|
Total
|
12<L
|
11<L≤12
|
10<L≤11
|
|
2009 Jan~Aug
|
1637
|
194
|
1431
|
12
|
|
2008 Jan~Aug
|
1763
|
129
|
1620
|
14
|
|
Growth Y/Y
|
-7.1
|
50.4
|
-11.7
|
-14.3
|
Source : www.english.chinabuses.com
Editor : shelly
Views:3329
Share :


