Sales Statistics of Zhengzhou Yutong Group (Jan-Aug) I
22 September 2009
1. Sales Volume of Yutong in China Bus Industry (Jan-Aug)
A. Bus Length Comparison
|
|
Total |
12<L |
11<L≤12 |
10<L≤11 |
9<L≤10 |
8<L≤9 |
7<L≤8 |
6<L≤7 |
5<L≤6 |
3.5<L≤5 |
|
2009 |
89636 |
1140 |
15119 |
12401 |
6815 |
11648 |
15246 |
15890 |
6236 |
5141 |
|
2008 |
113938 |
2638 |
21534 |
15673 |
8454 |
14374 |
21258 |
16776 |
6979 |
6252 |
|
Ratio |
-21.3 |
-56.8 |
-29.8 |
-20.9 |
-19.4 |
-19.0 |
-28.3 |
-5.3 |
-10.6 |
-17.8 |
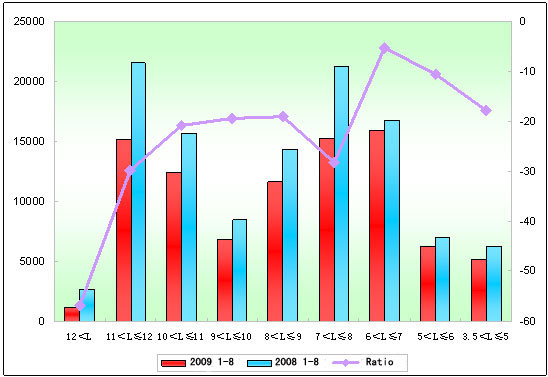
Remark: Compared the same period of last year, the whole sale in 2009 is down 21.3%. Sale of the first month is down 45.9%, the second month is down 41.5%, the third month is down 34.2%, the fourth month is down 32.7%, the fifth month is down 32.2%, the sixth month is down 33.65%, the seventh month is 28.03% and the eighth month is down 21.3%. All of these figures show that the financial crisis is lingering.
B. Seating Bus
|
|
Total |
12<L |
11<L≤12 |
10<L≤11 |
9<L≤10 |
8<L≤9 |
7<L≤8 |
6<L≤7 |
5<L≤6 |
3.5<L≤5 |
|
2009 |
57981 |
416 |
7711 |
4727 |
2842 |
6620 |
10905 |
13618 |
6001 |
5141 |
|
2008 |
72499 |
329 |
9949 |
7177 |
3927 |
7996 |
14586 |
15986 |
6303 |
6252 |
|
Ratio |
-20.0 |
26.4 |
-22.5 |
-34.1 |
-27.6 |
-17.2 |
-25.2 |
-14.8 |
-4.8 |
-17.8 |
Remark: Compared the same period of last year, the whole sale in 2009 is down 20.0%, only 12<L bus increases with 26.4%. The most impacted sector is 10~11m bus. From the list shows that Chinese auto market does not recover completely.
C. Inner City Bus
|
Total |
12<L |
11<L≤12 |
10<L≤11 |
9<L≤10 |
8<L≤9 |
7<L≤8 |
6<L≤7 |
5<L≤6 |
|
|
2009 |
29896 |
529 |
5977 |
7662 |
3970 |
4995 |
4340 |
2161 |
235 |
|
2008 |
39290 |
2160 |
9965 |
8482 |
4376 |
6376 |
6599 |
682 |
650 |
|
Ratio |
-23.9 |
-75.5 |
-40.0 |
-9.7 |
-9.3 |
-21.7 |
-34.2 |
216.9 |
-63.8 |
Remark: Compared the same period of last year, the sale in Jan – Aug this year is down 23.9% because of global economic downturn. Only 6~7m bus increases with 216.9%. This figure shows the country’s stimulus package is at work.
D. Sleeper Bus
|
|
Total |
12<L |
11<L≤12 |
10<L≤11 |
|
2009 Jan-Aug |
1637 |
194 |
1431 |
12 |
|
2008 Jan-Aug |
1763 |
129 |
1620 |
14 |
|
Ratio |
-7.1 |
50.4 |
-11.7 |
-14.3 |
Remark: Compared the same period of last year, the sale in Jan – Aug this year is down 7.1%. The most impacted sector is 11~12m bus that is down 11.7%. All in all, the sale of sleeper bus is stable.
2. Sale Volume of Yutong
A. Bus Length Comparison
|
|
Total |
12<L |
11<L≤12 |
10<L≤11 |
9<L≤10 |
8<L≤9 |
7<L≤8 |
6<L≤7 |
|
2009 Jan-Aug |
15464 |
165 |
3862 |
1923 |
917 |
2416 |
3993 |
2188 |
|
2008 Jan-Aug |
18480 |
253 |
5201 |
2487 |
525 |
2539 |
5236 |
2239 |
|
Ratio
|
-16.3 |
-37.3 |
-25.7 |
-22.7 |
74.7 |
-4.8 |
-23.7 |
-2.3 |
|
Industrial Ratio |
-21.3 |
-56.8 |
-29.8 |
-20.9 |
-19.4 |
-19.0 |
-28.3 |
-5.3 |
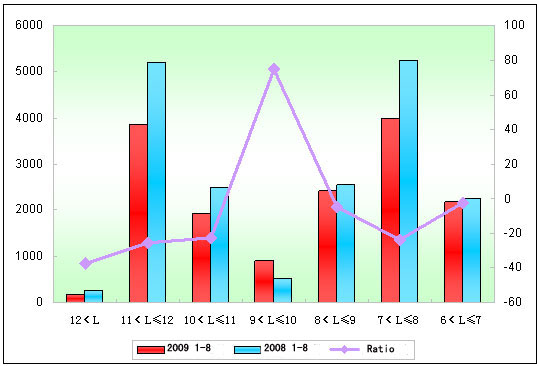
Remark: Compared the same period of last year, the sale in Jan – Aug this year is down 16.3%. Yutong’s top place in China buses industry is impacted by the global financial crisis. The whole sale is down, except the length of 9~10m bus. The most impacted sector is large-size bus and it is down 37.3%. The list also shows that the whole bus industry in this sector is down 56.8%. From the industry ratio shows that Yutong bus in 9-10m sector is up 74.7%. Regarding the 11~12m bus sector, the sale volume of Yutong bus reaches 3862 units. Compared Kinglong, Golden Dragon and Higer, its sale is good.
Source : english.chinabuses.com
Editor : Frederick
Views:5143