Public Bus Market Sum and Predicting of 2009 1st Half Year
20 August 2009
Sale and 2008 data comparing analysis of public bus in 2009 1st half year
|
|
Total
|
12<L
|
11<L≤12
|
10<L≤11
|
9<L≤10
|
|
2009 1st half year
|
20402
|
466
|
3643
|
5379
|
2569
|
|
2008 1st half year
|
31529
|
1917
|
7554
|
6550
|
3642
|
|
-35.3
|
-75.7
|
-51.8
|
-17.9
|
-29.5
|
|
|
|
8<L≤9
|
7<L≤8
|
6<L≤7
|
5<L≤6
|
|
|
2009 1st half year
|
3565
|
3109
|
1472
|
199
|
|
|
2008 1st half year
|
5076
|
5633
|
558
|
599
|
|
|
Growth Y/Y
|
-29.8
|
-44.8
|
163.8
|
-66.8
|
|
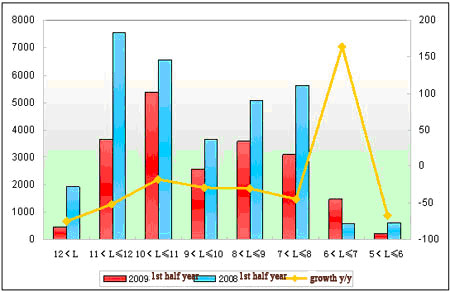
Analysis from the chart: 2009 1st half year public bus decreased 35.3%, which is the 6th decreased month of bus industry since last year, marking that public bus market is also influenced by Financial Crisis, and also is the main reason of the bus market full decrease in 2009 1st half year. In the term of length,only 6~7m bus is positive growth,and the speed come to163.8%, other length bus are all decline.
Source : www.english.chinabuses.com
Editor : Xiuli
Views:5604
Share :