2009 Jan ~ May Xiamen Kinglong Sale Data Analysis
09 July 2009
Growth Situation Analysis of Xiamen Kinglong
Sale growth analysis on every length bus
|
|
Total
|
12<L
|
11<L≤12
|
10<L≤11
|
9<L≤10
|
8<L≤9
|
7<L≤8
|
6<L≤7
|
5<L≤6
|
3.5<L≤5
|
|
2009
Jan~May |
3987
|
5
|
1370
|
517
|
240
|
801
|
384
|
|
670
|
0
|
|
2008
Jan~May |
5785
|
0
|
2583
|
447
|
347
|
1232
|
551
|
|
375
|
250
|
|
Growth Y/Y
|
-31.1
|
100
|
-46.96
|
15.65
|
-30.8
|
-34.98
|
-30.3
|
|
78.6
|
-100
|
|
Industry Growth
|
-32.2
|
-56.2
|
-38.0
|
-19.4
|
-27.6
|
-28.3
|
-43.8
|
-22.8
|
-20.8
|
-39.2
|
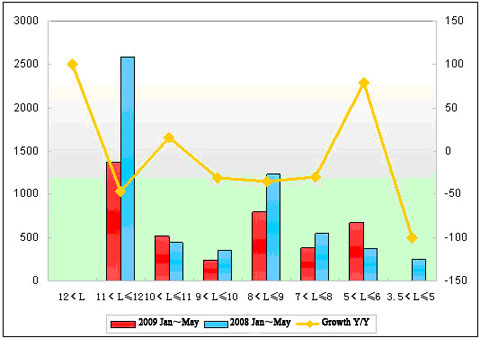
Xiamen Kinglong Jan ~ May sale are less 1798 units than the same period of last year, 31.1 percent reduction, which is lower than Jan—April, higher than the growth of industry 1.1 percentage points.
Source : www.english.chinabuses.com
Editor : Shelly
Views:5630
Share :