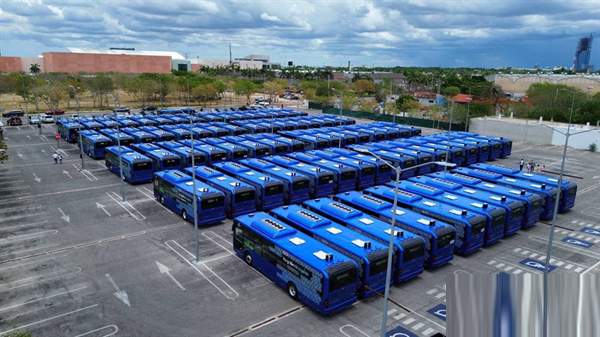
China’s Bus Export Volume Reached 18,681 Units from January to April,2020
12 June 2020
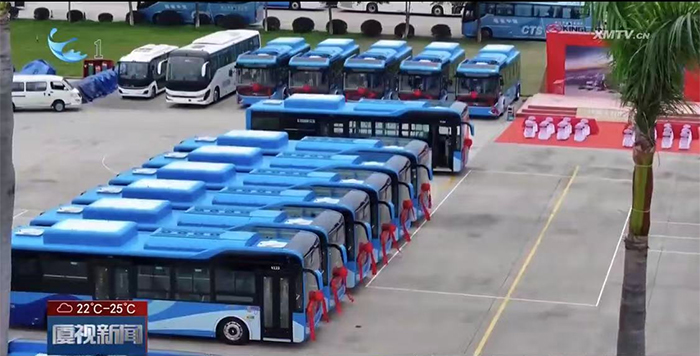
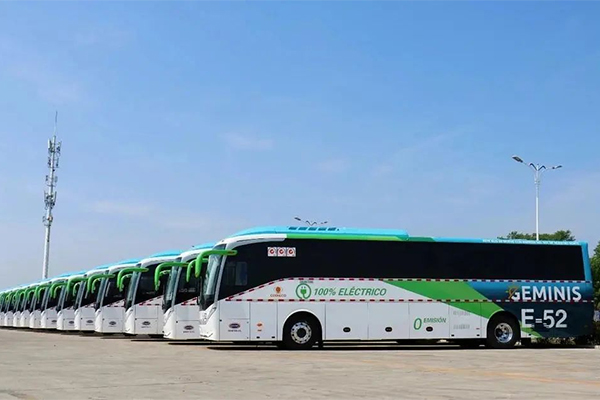
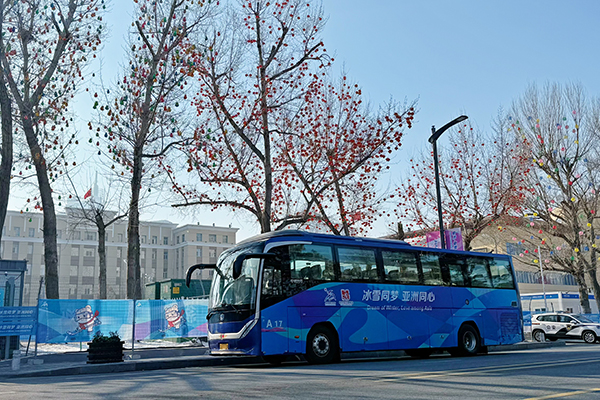
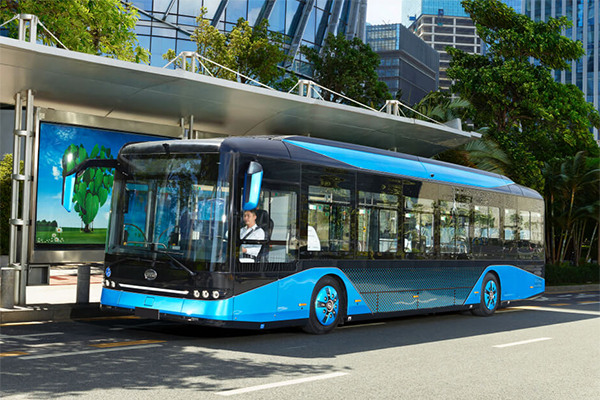
According to China’s General Administration of Customs, China exported 7,000 units buses & coaches in April this year. From January to April, China’s export volume reached 18,681 units, up by 11.97% year on year.
Table 1 Bus Exports, Total Bus Sales, Total Commercial Vehicle Sales
| Bus Exports | Total Bus Sales | Total Commercial Vehicle Sales | |
| Jan.-Apr., 2020 | 19,000 units | 104,000 units | 1,328,000 units |
| Jan.-Apr., 2019 | 17,000 units | 133,000 units | 1,516,000 units |
| Growth Rate | 11.97% | -21.1% | -12.4% |
Table 2 Bus Export Volume According to Sizes
| Large Bus | Medium Bus | Light Bus | Total | |
| Export Volume in Jan.-Apr., 2020 | 5,400 units | 1,400 units | 12,200 units | 19,000 units |
| Export Volume in Jan.-Apr., 2019 | 5,770 units | 830 units | 10,400 units | 17,000 units |
| Growth Rate | -7.0% | 69.0% | 17.0% | 11.97 |
Table 3 Top Ten Bus Exporters
| Electric Bus | Plug-in Hybrid Bus | Total | |
| Export Volume in Jan.-Apr., 2020 | 385 units | 52 units | 437 units |
| Export Volume in Jan.-Apr., 2019 | 213 units | 70 units | 283 units |
| Growth Rate | 80.75% | -26.0% | 54.4% |
Table 4 New Energy Bus Export
| Bus Makers | Export Volume in Jan.-Apr. | Growth Rate | |
| 1 | King Long | 4,270 | 5.75% |
| 2 | Golden Dragon | 2,970 | 138.75% |
| 3 | Zhongtong | 1,549 | 186.32% |
| 4 | Yutong | 1,067 | -42.76% |
| 5 | Higer | 542 | -51.82% |
| 6 | Asiastar | 414 | -11.54% |
| 7 | Foton AUV | 250 | 108.3% |
| 8 | Ankai | 236 | -65.95% |
| 9 | BYD | 182 | -21.55% |
| 10 | Sunlong | 77 | 2.67% |
Table 5 Top Ten Bus Export Destinations
| Bus Export Volume in Jan.-Apr., 2020 (units) | Bus Export Volume in Jan.-Apr., 2020 (units) | Growth Rate | ||
| 1 | Egypt | 5,601 | 1,155 | 370.0% |
| 2 | Saudi Arabia | 2,256 | 1,194 | 88.9% |
| 3 | Peru | 1,384 | 2,128 | -35.0% |
| 4 | Bolivia | 1.058 | 2,212 | -52.2% |
| 5 | Vietnam | 837 | 1,663 | -49.7% |
| 6 | Venezuela | 780 | 0 | --- |
| 7 | Philippines | 777 | 891 | -12.8% |
| 8 | UAE | 719 | 202 | 255.9% |
| 9 | Nigeria | 548 | 251 | 118.3% |
| 10 | Malaysia | 510 | 633 | -19.4% |
| Total of Top 10 | 14,470 | 10,329 | 40.1% | |
| Total of Bus Export | 18,681 | 16,683 | 11.97% |
Table 6 Percentage of Bus Exports According to Prices in Jan.-Apr.
| Below 100,000 RMB | 100,000- 200,000 RMB |
200,000- 250,000 RMB |
250,000- 300,000 RMB |
300,000- 400,000 RMB |
Above 400,000 RMB |
|
| % | 23.0% | 27.2% | 23.4% | 10.6% | 9.9% | 5.9% |
Source : www.chinabuses.org
Editor : Lucy
Views:9371


