Bus Industry Sales Growth Analysis in January - October of 2012 (II)
15 January 2013
www.chinabuses.org: Bus sales from January to October increase by 5.05% year-on-year, including -7.35% of coaches, -2.39% of city buses and -74.2% of sleeper buses. School buses make a great contribution to the growth and sales reach 22143 units.
(1) Overall Sales Growth Condition of Different Lengths
|
|
Total |
12<L |
11<L≤12 |
10<L≤11 |
9<L≤10 |
|
Jan.-Oct. 2012 |
197824 |
1994 |
41721 |
21806 |
11119 |
|
Jan.-Oct. 2011 |
188314 |
2556 |
36691 |
21865 |
10302 |
|
Y-O-Y Rise |
5.05 |
-21.99 |
13.7 |
-0.27 |
7.9 |
|
|
8<L≤9 |
7<L≤8 |
6<L≤7 |
5<L≤6 |
3.5<L≤5 |
|
Jan.-Oct. 2012 |
23930 |
29847 |
23939 |
15862 |
27606 |
|
Jan.-Oct. 2011 |
22485 |
28294 |
23398 |
14896 |
27827 |
|
Y-O-Y Rise |
6.4 |
5.49 |
2.3 |
6.5 |
-0.79 |
From the above we can see that sales in Jan.-Oct. Increase by 5.05% year-on-year, which is the tenth consecutive growth. Except super large buses, 10-11m and 3.5-5m, sales of other lengths increase. Sales of 11-12m increase the most and sales of super large buses decrease the most.
(2) City Bus Sales Growth Condition of Different Lengths
|
|
Total |
12<L |
11<L≤12 |
10<L≤11 |
9<L≤10 |
|
Jan.-Oct. 2012 |
51563 |
1633 |
17243 |
11108 |
4256 |
|
Jan.-Oct. 2011 |
52823 |
1900 |
12474 |
12241 |
5313 |
|
Y-O-Y Rise |
-2.39 |
-14.1 |
38.2 |
-9.26 |
-19.9 |
|
|
|
8<L≤9 |
7<L≤8 |
6<L≤7 |
5<L≤6 |
|
Jan.-Oct. 2012 |
|
7069 |
7086 |
2354 |
659 |
|
Jan.-Oct. 2011 |
|
7620 |
8948 |
2852 |
720 |
|
Y-O-Y Rise |
|
-7.23 |
-20.8 |
-17.46 |
-8.47 |
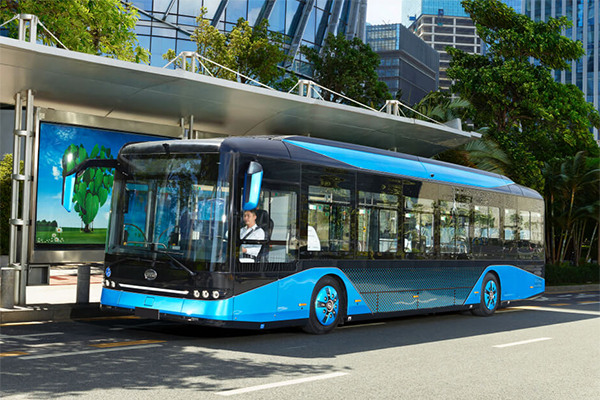
In Jan.-Oct. 2012, sales of city buses decrease by 2.39% year-on-year, less than industrial average and coaches. Sales of 7-8m city buses decrease the most, then 6-7m and super large buses. Sales of 11-12m increase the most.
Source : www.chinabuses.org
Editor : Song
Views:4080


