Market Analysis on 8m-10m Long Coaches in Jan.-Sept. 2012 II
10 December 2012
Part Four: The specific segment analysis of 8m-10m long coach products in Jan.-Sept. 2011 & 2012
1. The specific segment analysis of 8m-9m long coach products in Jan.-Sept. 2011 & 2012
Table Four: Statistics of 8m-9m long coach products' specific segments in Jan.-Sept. 2011 & 2012
|
|
City Coaches |
Tourist Coaches |
Commuter Coaches |
Coaches in the Markets/Stores (Including Renting) |
Others |
Total |
|
Sales Volume in 2012 |
7001 |
3129 |
1757 |
1293 |
133 |
13313 |
|
Market Share in 2012 |
52.6% |
23.5% |
13.2% |
9.7% |
1.0% |
100% |
|
Market Share in 2011 |
54.3% |
22.5% |
12.8% |
9.3% |
1.1% |
100 |
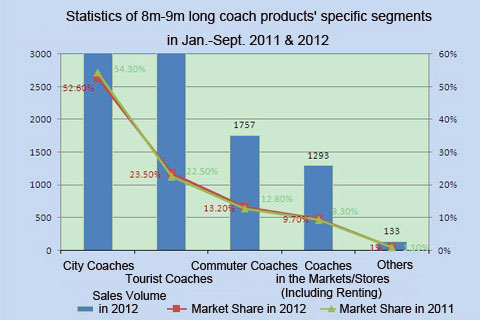
Chart Two: Statistics of 8m-9m long coach products' specific segments in Jan.-Sept. 2011 & 2012
2. The specific segment analysis of 9m-10m long coach products in Jan.-Sept. 2011 & 2012
Table Five: Statistics of 9m-10m long coach products' specific segments in Jan.-Sept. 2011 & 2012
|
|
City Coaches |
Tourist Coaches |
Commuter Coaches |
Coaches in the Markets/Stores (Including Renting) |
Others |
Total |
|
Sales Volume in 2012 |
2834 |
1363 |
826 |
571 |
62 |
5656 |
|
Market Share in 2012 |
50.1% |
24.1% |
14.6% |
10.1% |
1.1% |
100% |
|
Market Share in 2011 |
51.3% |
23.6% |
13.4% |
9.5% |
2.2% |
100% |
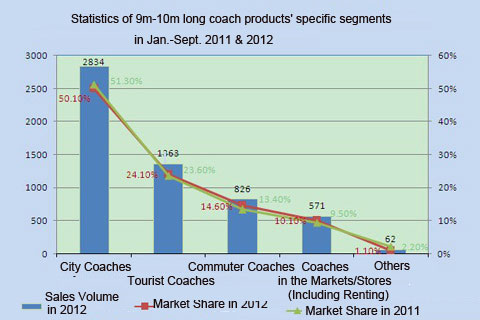
Chart Three: Statistics of 9m-10m long coach products' specific segments in Jan.-Sept. 2011 & 2012
Part Five: The market share analysis of 8m-10m long coach products in Jan.-Sept. 2008 & 2012
Table Six: The market share analysis of 8m-9m long coach products in Jan.-Sept. 2008 & 2012
|
Enterprisers |
2012 |
2011 |
2010 |
2009 |
2008 |
|
Yutong |
39.12 |
34.03 |
33.15 |
30.8 |
24.6 |
|
Higer |
16.1 |
15.87 |
17.1 |
15.7 |
19.78 |
|
King Long |
13.9 |
12.64 |
12.96 |
14.6 |
19.4 |
|
Golden Dragon |
9.4 |
10.9 |
12.29 |
14.9 |
6.7 |
|
Zhongtong |
3.67 |
6.17 |
4.72 |
7.3 |
4.82 |
|
Sunlong |
2.67 |
2.27 |
4.17 |
3.04 |
3.23 |
|
Ankai |
1.64 |
1.83 |
2.41 |
2.02 |
3.13 |
|
JAC |
1.61 |
1.53 |
2.37 |
1.80 |
1.6 |
|
Guilin |
1.47 |
1.83 |
1.76 |
0.41 |
1.49 |
|
Shuchi |
0.87 |
0.47 |
0.35 |
0.86 |
0.86 |
|
Total |
90.45 |
87.54 |
91.28 |
91.43 |
85.61 |
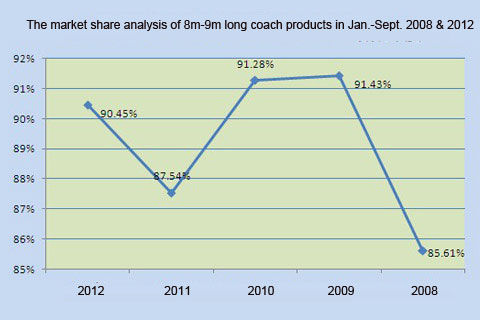
Chart Four: The market share analysis of 8m-9m long coach products in Jan.-Sept. 2008 & 2012
Table Seven: The market share analysis of 8m-9m long coach products in Jan.-Sept. 2008 & 2012
|
Enterprisers |
2012 |
2011 |
2010 |
2009 |
2008 |
|
Yutong |
37.5 |
40.7 |
40.55 |
21.28 |
9.0 |
|
King Long |
16.3 |
9.6 |
8.54 |
11.64 |
12.89 |
|
Ankai |
13.17 |
5.4 |
2.18 |
2.1 |
4.9 |
|
Higer |
4.98 |
9.39 |
5.54 |
29.87 |
25.5 |
|
Golden Dragon |
3.1 |
6.64 |
10.08 |
7.4 |
5.62 |
|
Zhongtong |
2.98 |
4.25 |
4.53 |
1.3 |
2.0 |
|
JAC |
2.9 |
3.9 |
6.21 |
1.37 |
1.58 |
|
Youngman |
2.5 |
2.48 |
2.65 |
1.56 |
2.12 |
|
Yaxing |
2.33 |
0.89 |
1.37 |
3.1 |
5.35 |
|
Foton |
1.84 |
2.16 |
2.94 |
1.12 |
0.28 |
|
Total |
87.6 |
85.41 |
84.59 |
80.74 |
69.24 |
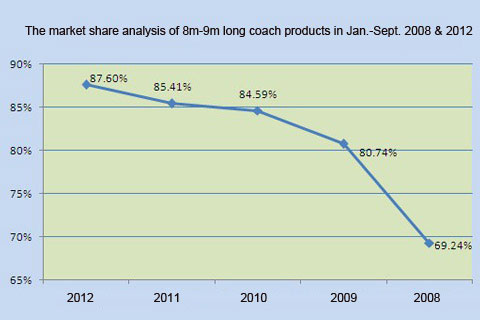
Chart Five: The market share analysis of 8m-9m long coach products in Jan.-Sept. 2008 & 2012
Source : www.chinabuses.org
Editor : Lily
Views:3836


