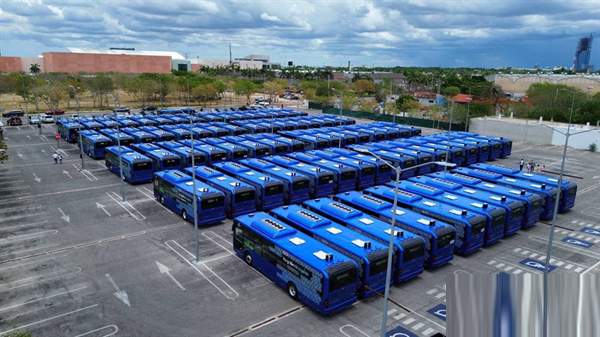
King Long Sales Growth Analysis in January - June of 2012 (I)
20 September 2012
www.chinabuses.org: 1. Overall Sales Growth Condition of Different Lengths
|
|
Total |
12<L |
11<L≤12 |
10<L≤11 |
9<L≤10 |
|
Jan.-June 2012 |
111097 |
1141 |
23707 |
11956 |
6555 |
|
Jan.-June 2011 |
103912 |
1365 |
20457 |
11915 |
5417 |
|
Y-O-Y Rise |
6.91 |
-16.4 |
15.9 |
0.34 |
21.0 |
|
|
8<L≤9 |
7<L≤8 |
6<L≤7 |
5<L≤6 |
3.5<L≤5 |
|
Jan.-June 2012 |
13624 |
16119 |
13431 |
8523 |
16041 |
|
Jan.-June 2011 |
11631 |
15997 |
12811 |
8357 |
15962 |
|
Y-O-Y Rise |
17.1 |
-27.4 |
4.84 |
1.99 |
0.49 |
We can see from the above that sales in the half of 2012 increase 6.91% over last year. Sales in the first half of 2011 increase 12.4%. Only sales of over-12m and 7m-8m decrease. Sales of 7m-8m decrease the most and sales of 9m-10m increase the most, which means: in one hand, bus market in the half of 2012 declines; in another hand, different segment market shows different characteristics.
2. King Long Sales Growth Analysis of Different Lengths
|
|
Total |
12<L |
11<L≤12 |
10<L≤11 |
9<L≤10 |
|
Jan.-June 2012 |
13613 |
22 |
2940 |
1459 |
1006 |
|
Jan.-June 2011 |
10837 |
193 |
2267 |
1505 |
447 |
|
Y-O-Y Rise |
25.6 |
-88.6 |
29.7 |
-3.06 |
125.06 |
|
Industry Rise |
6.91 |
-16.4 |
15.9 |
0.34 |
21.0 |
|
|
8<L≤9 |
7<L≤8 |
6<L≤7 |
5<L≤6 |
3.5<L≤5 |
|
Jan.-June 2012 |
1831 |
413 |
256 |
263 |
5423 |
|
Jan.-June 2011 |
1387 |
448 |
208 |
343 |
4039 |
|
Y-O-Y Rise |
32.0 |
-7.8 |
23.1 |
5.8 |
34.3 |
|
Industry Rise |
17.1 |
-27.4 |
4.84 |
1.99 |
0.49 |
We can see from the above that:
(1) Sales of King Long in Jan.-June 2012 increase 25.6%, which is the best among Yutong, King Long, Higer and Golden Dragon, 18.6% more than industrial average.
(2) Sales of 3.5m-5m, 9m-10m and 11m-12m make the great contribution to the growth of King Long.
(3) Sales of King Long 11m-12m buses rank No.3, lower than Yutong and Higer. Sales of 10m-11m and 7m-8m decrease.
Source : www.chinabuses.org
Editor : song
Views:4305


