Xiamen Golden Dragon Sales Data Analysis in the First Five Months of 2012 (II)
04 July 2012
www.chinabuses.org:II Seat Bus Sales Growth Analysis of Different Lengths in the First Five Months of 2012
1. Industry Seat Bus Sales Growth Condition of Different Lengths
Table 3: Seat Bus Sales Growth Table of Different Lengths in the First Five Months of 2012
|
|
Total |
12<L |
11<L≤12 |
10<L≤11 |
9<L≤10 |
|
First five months of 2012 |
57017 |
183 |
10812 |
4375 |
2529 |
|
First five months of 2011 |
59500 |
184 |
9578 |
4308 |
2041 |
|
Y-O-Y Rise
|
-4.2 |
-0.54 |
12.9 |
1.56 |
23.9 |
|
8<L≤9 |
7<L≤8 |
6<L≤7 |
5<L≤6 |
3.5<L≤5 |
|
|
First five months of 2012 |
6627 |
6804 |
6668 |
5585 |
13434 |
|
First five months of 2011 |
6500 |
8416 |
9090 |
6358 |
13025 |
|
Y-O-Y Rise
|
1.95 |
-19.2 |
-26.6 |
-12.2 |
3.1 |
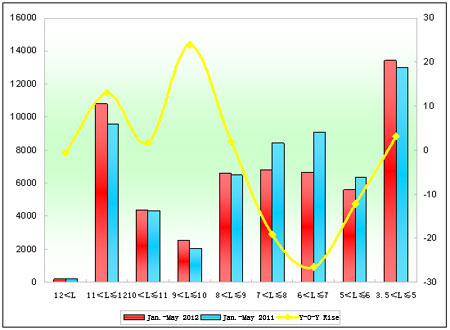
Chart 3: Seat Bus Sales Growth Chart of Different Lengths in the First Five Months of 2012
We can see from the above that:
Sales of seat buses in the first five months of 2012 decrease 4.2%, 19% less than that in the first five months of 2011. Sales of 5m-6m, 6m-7m, 7m-8m and super large buses decrease, while sales of 9m-10m increase the most and sales of 6m-7m decrease the most.
2. Golden Dragon Seat Buses
Table 4: Xiamen Golden Dragon Seat Bus Sales Growth Table of Different Lengths in the First Five Months of 2012
|
|
Total |
12<L |
11<L≤12 |
10<L≤11 |
9<L≤10 |
|
First five months of 2012 |
7293 |
4 |
706 |
391 |
77 |
|
First five months of 2011 |
7681 |
4 |
807 |
446 |
165 |
|
Y-O-Y Rise
|
-5.05 |
0 |
-12.5 |
-12.3 |
-53.3 |
|
Industry Rise |
-4.2 |
-0.54 |
12.9 |
1.56 |
23.9 |
|
8<L≤9 |
7<L≤8 |
6<L≤7 |
5<L≤6 |
3.5<L≤5 |
|
|
First five months of 2012 |
594 |
126 |
770 |
311 |
4314 |
|
First five months of 2011 |
782 |
67 |
1123 |
440 |
3847 |
|
Y-O-Y Rise
|
-24 |
88.1 |
-31.4 |
-29.3 |
12.1 |
|
Industry Rise |
1.95 |
-19.2 |
-26.6 |
-12.2 |
3.1 |
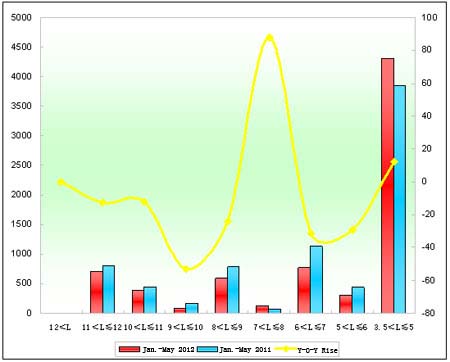
Chart 4: Xiamen Golden Dragon Seat Bus Sales Growth Chart of Different Lengths in the First Five Months of 2012
We can see from the above that:
(1) Sales of Golden Dragon Seat Buses in the first five months of 2012 decrease 5.05%, 1% less than industrial average, which represents the bad condition of Golden Dragon seat buses.
(2) Sales of super large seat buses in the first five months of 2012 reach 4 units. Except 3.5m-5m HiAce, sales of other lengths decrease.
Source : www.chinabuses.org
Editor : Song
Views:4379


