Suzhou Higer Sales Data Analysis in the First Five Months of 2012 (I)
21 June 2012
www.chinabuses.org:I Bus Industry Sales Growth Analysis in the First Five Months of 2012
1. Overall Sales Growth Condition of Different Lengths
Table 1: Sales Growth Table of Different Lengths in the First Five Months of 2012
|
|
Total |
12<L |
11<L≤12 |
10<L≤11 |
9<L≤10 |
|
First five months of 2012 |
90543 |
910 |
19060 |
9295 |
5127 |
|
First five months of 2011 |
82536 |
1151 |
16026 |
9207 |
4405 |
|
Y-O-Y Rise
|
9.7 |
-20.9 |
18.9 |
0.96 |
16.3 |
|
8<L≤9 |
7<L≤8 |
6<L≤7 |
5<L≤6 |
3.5<L≤5 |
|
|
First five months of 2012 |
11126 |
12970 |
10951 |
6963 |
14141 |
|
First five months of 2011 |
9106 |
12406 |
10147 |
6789 |
13299 |
|
Y-O-Y Rise
|
22.2 |
4.5 |
7.9 |
2.6 |
9.7 |
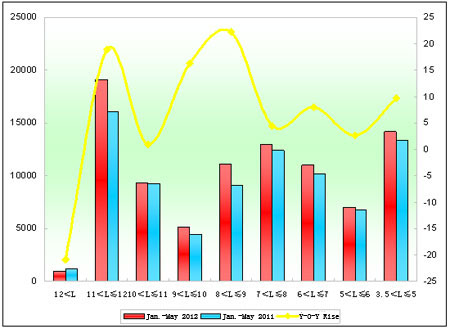
Chart 1: Sales Growth Chart of Different Lengths in the First Five Months of 2012
We can see from the above that:
Sales in the first five months of 2012 increase 9.7% over last year, 0.7% less than the growth rate of last year. Sales of 12m super large buses decrease, while sales of other lengths increase. Sales of 8m-9m increase the most, then 11m-12m and 9m-10m.
2. Suzhou Higer Sales Growth Analysis of Different Lengths
Table 2: Suzhou Higer Sales Growth Table of Different Lengths in the First Five Months of 2012
|
|
Total |
12<L |
11<L≤12 |
10<L≤11 |
9<L≤10 |
|
First five months of 2012 |
8970 |
87 |
2511 |
1265 |
377 |
|
First five months of 2011 |
8550 |
89 |
2134 |
1227 |
578 |
|
Y-O-Y Rise
|
4.9 |
-2.2 |
17.7 |
3.1 |
-34.8 |
|
Industry Rise |
9.7 |
-20.9 |
18.9 |
0.96 |
16.3 |
|
8<L≤9 |
7<L≤8 |
6<L≤7 |
5<L≤6 |
|
|
|
First five months of 2012 |
1255 |
1252 |
66 |
2157 |
|
|
First five months of 2011 |
1426 |
1610 |
550 |
936 |
|
|
Y-O-Y Rise
|
-12 |
-22.2 |
-88 |
130.4 |
|
|
Industry Rise |
22.2 |
4.5 |
7.9 |
2.6 |
|
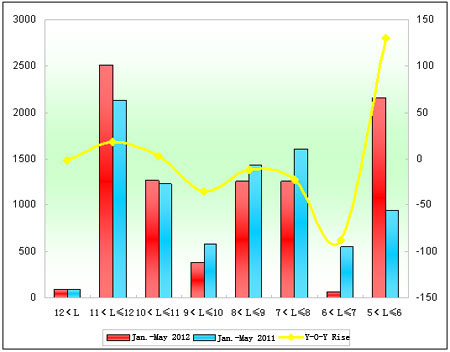
Chart 2: Suzhou Higer Sales Growth Chart of Different Lengths in the First Five Months of 2012
We can see from the above that:
(1) Sales of Higer buses in the first five months of 2012 increase 4.9%, 5% less than industrial average, which means sales growth of Higer buses slow down. Sales of 5m-6m increase the most, by 1221 units, then 11m-12m.
(2) Sales of super large buses reach 87 units, decreasing 2.2% over last year, i.e. 2 units.
Source : www.chinabuses.org
Editor : Song
Views:3346


