Xiamen Golden Dragon Sales Data Analysis in Q1 of 2012 (III)
17 May 2012
www.chinabuses.org:III City Bus Sales Growth Analysis of Different Lengths in Q1 of 2012
1. Industry City Bus Sales Growth Condition of Different Lengths
Table 5: City Bus Sales Growth Table of Different Lengths in Q1 of 2012
|
|
Total |
12<L |
11<L≤12 |
10<L≤11 |
9<L≤10 |
|
Q1 of 2012 |
12336 |
456 |
3937 |
3021 |
1152 |
|
Q1 of 2011 |
11286 |
309 |
3162 |
2406 |
1251 |
|
Y-O-Y Rise
|
9.3 |
47.57 |
24.5 |
25.56 |
-7.9 |
|
8<L≤9 |
7<L≤8 |
6<L≤7 |
5<L≤6 |
3.5<L≤5 |
|
|
Q1 of 2012 |
1560 |
1484 |
653 |
53 |
20 |
|
Q1 of 2011 |
1293 |
2123 |
498 |
87 |
157 |
|
Y-O-Y Rise
|
20.6 |
-30.1 |
31.1 |
-39.1 |
-87.3 |
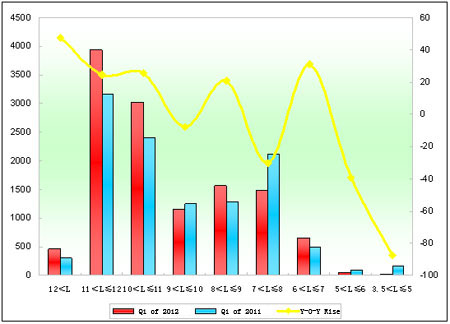
Chart 5: City Bus Sales Growth Chart of Different Lengths in Q1 of 2012
We can see from the above that:
Sales of city buses in Q1 of 2012 increase 9.3%, which means city bus market is better than seat bus market. Sales of over-12-meter increase the most; sales of 11-12 meters, 10-11 meters, 8-9 meters and 6-7 meters increase over 20% while others decrease.
2. Xiamen Golden Dragon City Buses
Table 6: Xiamen Golden Dragon City Bus Sales Growth Table of Different Lengths in Q1 of 2012
|
|
Total |
11<L≤12 |
10<L≤11 |
|
Q1 of 2012 |
140 |
56 |
25 |
|
Q1 of 2011 |
650 |
133 |
261 |
|
Y-O-Y Rise
|
-78.5 |
-57.9 |
-90.4 |
|
Industry Rise |
9.3 |
24.5 |
25.56 |
|
9<L≤10 |
8<L≤9 |
7<L≤8 |
|
|
Q1 of 2012 |
0 |
48 |
11 |
|
Q1 of 2011 |
15 |
2 |
239 |
|
Y-O-Y Rise
|
-100 |
2300 |
-95.4 |
|
Industry Rise |
-7.9 |
20.6 |
-30.1 |
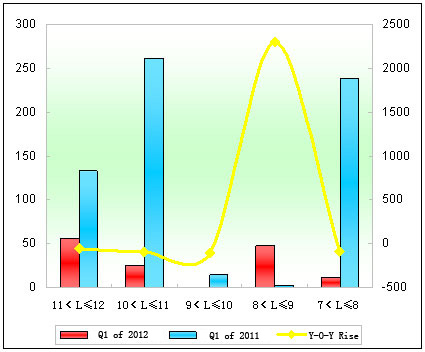
Chart 6: Xiamen Golden Dragon City Bus Sales Growth Chart of Different Lengths in Q1 of 2012
We can see from the above that:
(1) Sales of Golden Dragon city buses in Q1 reach 140 units, decreasing 78.5% over last year, which means the decreasing sales of city buses in Q1 hamper the development of Golden Dragon.
(2) Only sales of 8m-9m city buses increase, added number reaching 46 units.
Source : www.chinabuses.org:
Editor : Chao
Views:3150