Xiamen Golden Dragon Sales Data Analysis in Q1 of 2012 (II)
17 May 2012
www.chinabuses.org:II Seat Bus Sales Growth Analysis of Different Lengths in Q1 of 2012
1. Industry Seat Bus Sales Growth Condition of Different Lengths
Table 3: Seat Bus Sales Growth Table of Different Lengths in Q1 of 2012
|
|
Total |
12<L |
11<L≤12 |
10<L≤11 |
9<L≤10 |
|
Q1 of 2012 |
32070 |
73 |
6123 |
2491 |
1412 |
|
Q1 of 2011 |
34513 |
88 |
5624 |
2367 |
1210 |
|
Y-O-Y Rise
|
-7.1 |
-17.05 |
8.9 |
5.2 |
16.7 |
|
8<L≤9 |
7<L≤8 |
6<L≤7 |
5<L≤6 |
3.5<L≤5 |
|
|
Q1 of 2012 |
3454 |
3785 |
3473 |
2807 |
8452 |
|
Q1 of 2011 |
3620 |
4512 |
4668 |
3842 |
8582 |
|
Y-O-Y Rise
|
-4.59 |
-16.1 |
-25.6 |
-26.9 |
-1.51 |
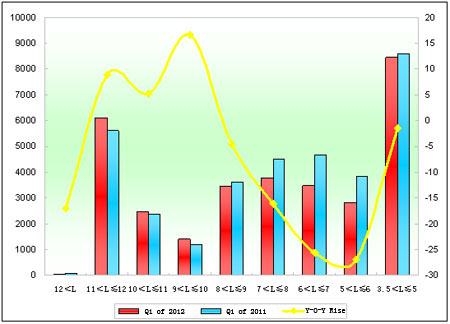
Chart 3: Seat Bus Sales Growth Chart of Different Lengths in Q1 of 2012
We can see from the above that:
Seat bus sales decrease 7.1% in Q1 of 2012. Sales of 11-12 meters, 10-11 meters and 9-10 meters increase while others decrease. Sales of 6-7 meters decrease the most, for most of 6-7 meters are school buses.
2. Xiamen Golden Dragon Seat Buses
Table 4: Xiamen Golden Dragon Seat Bus Sales Growth Table of Different Lengths in Q1 of 2012
|
|
Total |
12<L |
11<L≤12 |
10<L≤11 |
9<L≤10 |
|
Q1 of 2012 |
3993 |
0 |
398 |
184 |
41 |
|
Q1 of 2011 |
4423 |
3 |
512 |
261 |
94 |
|
Y-O-Y Rise
|
-9.7 |
-100 |
-80.9 |
-29.5 |
-56.3 |
|
Industry Rise |
-7.1 |
-17.05 |
8.9 |
5.2 |
16.7 |
|
8<L≤9 |
7<L≤8 |
6<L≤7 |
5<L≤6 |
3.5<L≤5 |
|
|
Q1 of 2012 |
349 |
100 |
396 |
165 |
2360 |
|
Q1 of 2011 |
510 |
45 |
429 |
277 |
2292 |
|
Y-O-Y Rise
|
-31.6 |
122.2 |
-7.7 |
-40.4 |
2.97 |
|
Industry Rise |
-4.59 |
-16.1 |
-25.6 |
-26.9 |
-1.51 |
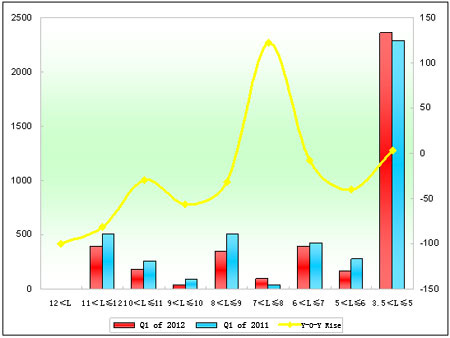
Chart 4: Seat Bus Sales Growth Chart of Different Lengths in Q1 of 2012
We can see from the above that:
(1) Sales of Golden Dragon seat buses in Q1 decrease 9.7%, 2.6% less than industrial average, which means sales decreasing of Golden Dragon is mainly due to city buses.
(2) Except 7m-8m and 3.5m-5m, sales of Golden Dragon seat buses decrease.
Source : www.chinabuses.org:
Editor : Chao
Views:4352


