Xiamen Golden Dragon Sales Data Analysis in Q1 of 2012 (I)
17 May 2012
www.chinabuses.org:I Bus Industry Sales Growth Analysis in Q1 of 2012
1. Overall Sales Growth Condition of Different Lengths
Table 1: Sales Growth Table of Different Lengths in Q1 of 2012
|
|
Total |
12<L |
11<L≤12 |
10<L≤11 |
9<L≤10 |
|
Q1 of 2012 |
51744 |
788 |
10601 |
5660 |
2846 |
|
Q1 of 2011 |
47001 |
454 |
9730 |
4778 |
2472 |
|
Y-O-Y Rise
|
10.09 |
21.1 |
8.95 |
18.46 |
15.1 |
|
8<L≤9 |
7<L≤8 |
6<L≤7 |
5<L≤6 |
3.5<L≤5 |
|
|
Q1 of 2012 |
5811 |
7397 |
6353 |
3719 |
8807 |
|
Q1 of 2011 |
4920 |
6647 |
5171 |
4090 |
8739 |
|
Y-O-Y Rise
|
18.11 |
11.3 |
22.86 |
-9.1 |
0.78 |
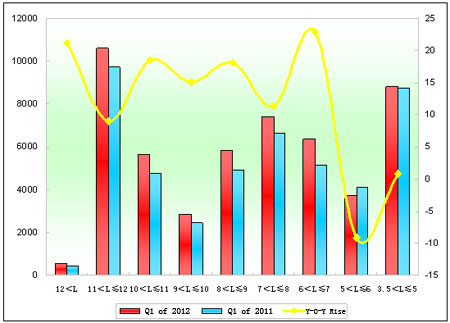
Chart 1: Sales Growth Chart of Different Lengths in Q1 of 2012
We can see from the above that:
Overall sales in Q1 of 2012 increase 10.09% over 2011. Sales of every length increase except 5-6 meters. Sales of 6-7 meters increase the most, up to 22.86%, then super large buses, up to 21.1%; and then 10-11 meters.
2. Xiamen Golden Dragon Sales Growth Analysis of Different Lengths
Table 2: Xiamen Golden Dragon Sales Growth Table of Different Lengths in Q1 of 2012
|
|
Total |
12<L |
11<L≤12 |
10<L≤11 |
9<L≤10 |
|
Q1 of 2012 |
4139 |
0 |
454 |
209 |
44 |
|
Q1 of 2011 |
5116 |
3 |
688 |
522 |
109 |
|
Y-O-Y Rise
|
-19.1 |
-100 |
-34 |
-59.96 |
-59.6 |
|
Industry Rise |
10.09 |
21.1 |
8.95 |
18.46 |
15.1 |
|
8<L≤9 |
7<L≤8 |
6<L≤7 |
5<L≤6 |
3.5<L≤5 |
|
|
Q1 of 2012 |
400 |
111 |
396 |
165 |
2360 |
|
Q1 of 2011 |
512 |
284 |
429 |
277 |
2292 |
|
Y-O-Y Rise
|
-21.8 |
-60.9 |
-7.7 |
-40.4 |
2.97 |
|
Industry Rise |
18.11 |
11.3 |
22.86 |
-9.1 |
0.78 |
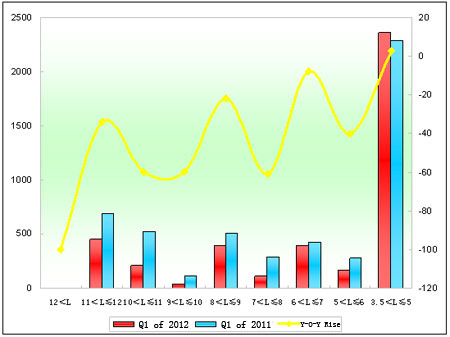
Chart 2: Suzhou Sales Growth Chart of Different Lengths in Q1 of 2012
We can see from the above that:
(1) Sales of Golden Dragon in Q1 decrease 19.1% over last year, 29% less than industrial average.
(2) Except 3.5m-5m, sales of Golden Dragon buses decrease.
(3) Product structure of Xiamen Golden Dragon is not rational that sales of below-8-meter account too much in the whole sales.
Source : www.chinabuses.org:
Editor : Chao
Views:4121


