Zhengzhou Yutong Sales Data Analysis in Q1 of 2012 (III)
04 May 2012
www.chinabuses.org:III City Bus Sales Growth Analysis of Different Lengths in Q1 of 2012
1. Industry City Bus Sales Growth Condition of Different Lengths
Table 5: City Bus Sales Growth Table of Different Lengths in Q1 of 2012
|
|
Total |
12<L |
11<L≤12 |
10<L≤11 |
9<L≤10 |
|
Q1 of 2012 |
12336 |
456 |
3937 |
3021 |
1152 |
|
Q1 of 2011 |
11286 |
309 |
3162 |
2406 |
1251 |
|
Y-O-Y Rise
|
9.3 |
47.57 |
24.5 |
25.56 |
-7.9 |
|
8<L≤9 |
7<L≤8 |
6<L≤7 |
5<L≤6 |
3.5<L≤5 |
|
|
Q1 of 2012 |
1560 |
1484 |
653 |
53 |
20 |
|
Q1 of 2011 |
1293 |
2123 |
498 |
87 |
157 |
|
Y-O-Y Rise
|
20.6 |
-30.1 |
31.1 |
-39.1 |
-87.3 |
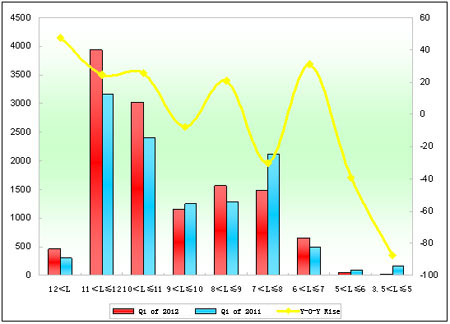
Chart 5: City Bus Sales Growth Chart of Different Lengths in Q1 of 2012
We can see from the above that:
Sales of city buses in Q1 of 2012 increase 9.3%, which means city bus market is better than seat bus market. Sales of over-12-meter increase the most; sales of 11-12 meters, 10-11 meters, 8-9 meters and 6-7 meters increase over 20% while others decrease.
2. Zhengzhou Yutong City Buses
Table 6: Zhengzhou Yutong City Bus Sales Growth Table of Different Lengths in Q1 of 2012
|
|
Total |
12<L |
11<L≤12 |
10<L≤11 |
|
Q1 of 2012 |
1972 |
200 |
864 |
441 |
|
Q1 of 2011 |
1515 |
174 |
555 |
113 |
|
Y-O-Y Rise
|
30.2 |
14.9 |
55.7 |
290.3 |
|
Industry Rise |
9.3 |
47.57 |
24.5 |
25.56 |
|
9<L≤10 |
8<L≤9 |
7<L≤8 |
|
|
|
Q1 of 2012 |
81 |
285 |
101 |
|
|
Q1 of 2011 |
168 |
185 |
320 |
|
|
Y-O-Y Rise
|
-51.8 |
54.1 |
-68.4 |
|
|
Industry Rise |
-7.9 |
20.6 |
-30.1 |
|
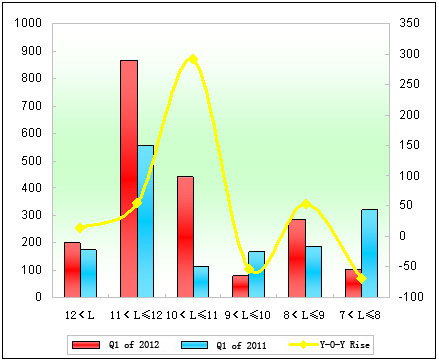
Chart 6: Zhengzhou Yutong City Bus Sales Growth Chart of Different Lengths in Q1 of 2012
We can see from the above that:
(1) Sales of Yutong city buses increase 30.2%, 21% more than industrial average, which means sales of Yutong city buses increase greatly, ranking No.1 among the four leading bus manufacturers in China.
(2) Sales of 10-11 meters increase the most, while sales of 7-8 meters decrease the most.
Source : www.chinabuses.org:
Editor : Chao
Views:4481


