Xiamen Golden Dragon Sales Data Analysis in January 2012 (II)
15 March 2012
www.chinabuses.org:II Seat Bus Sales Growth Analysis of Different Lengths in January 2012
1. Industry Seat Bus Sales Growth Condition of Different Lengths
Table 3: Seat Bus Sales Growth Table of Different Lengths in January 2012
|
|
Total |
12<L |
11<L≤12 |
10<L≤11 |
9<L≤10 |
|
2012.1 |
12114 |
752 |
1803 |
821 |
374 |
|
2011.1 |
17747 |
56 |
3378 |
1134 |
617 |
|
Y-O-Y Rise
|
-31.7 |
1243 |
-46.6 |
-27.6 |
-39.4 |
|
8<L≤9 |
7<L≤8 |
6<L≤7 |
5<L≤6 |
3.5<L≤5 |
|
|
2012.1 |
1402 |
1702 |
1232 |
1045 |
2983 |
|
2011.1 |
2007 |
2284 |
2054 |
1821 |
4396 |
|
Y-O-Y Rise
|
-30.1 |
-25.5 |
-32.3 |
-42.6 |
-32.1 |
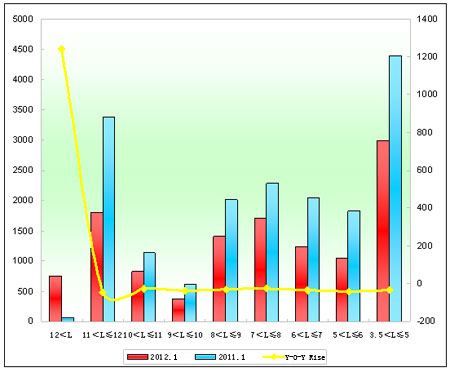
Chart 3: Seat Bus Sales Growth Chart of Different Lengths in January 2012
We can see from the above that:
Seat bus sales decrease 31.7% in January 2012. Sales of every length decrease except super large buses which increase 1243%. The decrease is mainly due to long spring festival holidays.
2. Xiamen King Long Seat Buses
Table 4: Xiamen King Long Seat Bus Sales Growth Table of Different Lengths in January 2012
|
|
Total |
12<L |
11<L≤12 |
10<L≤11 |
9<L≤10 |
|
2012.1 |
1374 |
0 |
122 |
81 |
6 |
|
2011.1 |
2063 |
2 |
320 |
168 |
57 |
|
Y-O-Y Rise
|
-33.4 |
-100 |
-61.8 |
-51.8 |
-89.5 |
|
Industry Rise |
-31.7 |
1243 |
-46.6 |
-27.6 |
-39.4 |
|
8<L≤9 |
7<L≤8 |
6<L≤7 |
5<L≤6 |
3.5<L≤5 |
|
|
2012.1 |
140 |
30 |
99 |
48 |
848 |
|
2011.1 |
294 |
19 |
144 |
127 |
932 |
|
Y-O-Y Rise
|
-52.3 |
57.9 |
-31.3 |
-62.2 |
-9 |
|
Industry Rise |
-30.1 |
-25.5 |
-32.3 |
-42.6 |
-32.1 |
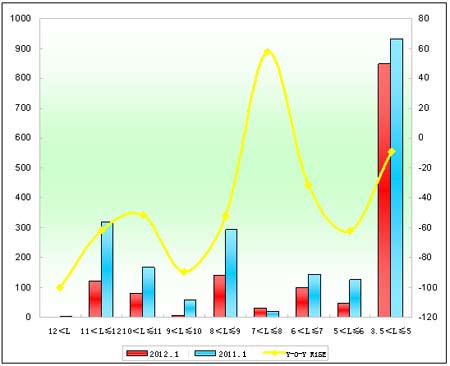
Table 4: Xiamen King Long Seat Bus Sales Growth Table of Different Lengths in January 2012
We can see from the above that:
(1) Sales of Xiamen Golden Dragon seat buses in January 2012 decrease 33.4%, 2% more than industrial average, which means it is not the main reason of decrease.
(2) Only sales of 7-8 meters increase and sales of 11-12 meters decrease the most.
Source : www.chinabuses.org:
Editor : Chao
Views:3919


