Xiamen King Long Sales Data Analysis in January 2012 (III)
09 March 2012
www.chinabuses.org:III City Bus Sales Growth Analysis of Different Lengths in January 2012
1. Industry City Bus Sales Growth Condition of Different Lengths
Table 5: City Bus Sales Growth Table of Different Lengths in January 2012
|
|
Total |
12<L |
11<L≤12 |
10<L≤11 |
9<L≤10 |
|
2012.1 |
4049 |
178 |
1041 |
994 |
532 |
|
2011.1 |
4920 |
67 |
1232 |
902 |
507 |
|
Y-O-Y Rise
|
-17.7 |
165.7 |
-15.5 |
10.2 |
4.9 |
|
8<L≤9 |
7<L≤8 |
6<L≤7 |
5<L≤6 |
3.5<L≤5 |
|
|
2012.1 |
444 |
579 |
256 |
23 |
2 |
|
2011.1 |
731 |
1060 |
296 |
59 |
66 |
|
Y-O-Y Rise
|
-39.3 |
-45.4 |
-13.5 |
-61 |
-97 |
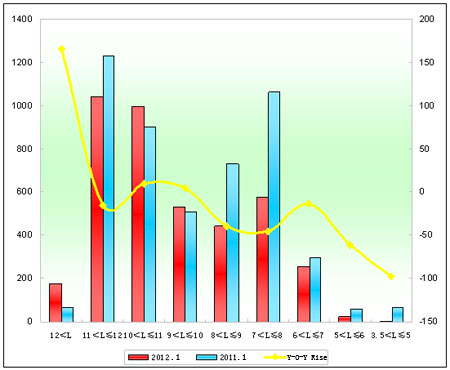
Chart 5: City Bus Sales Growth Chart of Different Lengths in January 2012
We can see from the above that:
Sales of city buses in January 2012 decrease 17.7%, less than seat buses. Sales of super large city buses, 10-11 meters and 9-10 meters increase.
2. Xiamen King Long City Buses
Table 6: Xiamen King Long City Bus Sales Growth Table of Different Lengths in January 2012
|
|
Total |
12<L |
11<L≤12 |
10<L≤11 |
|
2012.1 |
331 |
1 |
117 |
84 |
|
2011.1 |
386 |
25 |
244 |
32 |
|
Y-O-Y Rise
|
-14.2 |
-96 |
-52 |
162.5 |
|
Industry Rise |
-17.7 |
165.7 |
-15.5 |
10.2 |
|
9<L≤10 |
8<L≤9 |
7<L≤8 |
|
|
|
2012.1 |
43 |
83 |
3 |
|
|
2011.1 |
53 |
19 |
13 |
|
|
Y-O-Y Rise
|
-18.9 |
336.8 |
-76.9 |
|
|
Industry Rise |
4.9 |
-39.3 |
-45.4 |
|
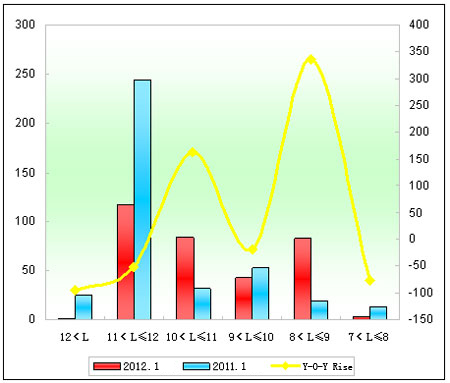
Chart 6: Xiamen King Long City Bus Sales Growth Chart of Different Lengths in January 2012
We can see from the above that:
(1) Sales of King Long city buses decrease 14.2%, 3.5% more than industrial average, which means sales of King Long city buses increase greatly, especially 10-11 meters and 8-9 meters.
(2) Only sales of 10-11 meters and 8-9 meters increase, sales of 11-12 decrease the most.
(3) Sales of King Long city buses increase greatly, making a great contribution to stop the decrease of King Long buses in January.
Source : www.chinabuses.org:
Editor : Chao
Views:3044


