Xiamen King Long Sales Data Analysis in January 2012 (II)
09 March 2012
www.chinabuses.org:II Seat Bus Sales Growth Analysis of Different Lengths in January 2012
1. Industry Seat Bus Sales Growth Condition of Different Lengths
Table 3: Seat Bus Sales Growth Table of Different Lengths in January 2012
|
|
Total |
12<L |
11<L≤12 |
10<L≤11 |
9<L≤10 |
|
2012.1 |
12114 |
752 |
1803 |
821 |
374 |
|
2011.1 |
17747 |
56 |
3378 |
1134 |
617 |
|
Y-O-Y Rise
|
-31.7 |
1243 |
-46.6 |
-27.6 |
-39.4 |
|
8<L≤9 |
7<L≤8 |
6<L≤7 |
5<L≤6 |
3.5<L≤5 |
|
|
2012.1 |
1402 |
1702 |
1232 |
1045 |
2983 |
|
2011.1 |
2007 |
2284 |
2054 |
1821 |
4396 |
|
Y-O-Y Rise
|
-30.1 |
-25.5 |
-32.3 |
-42.6 |
-32.1 |
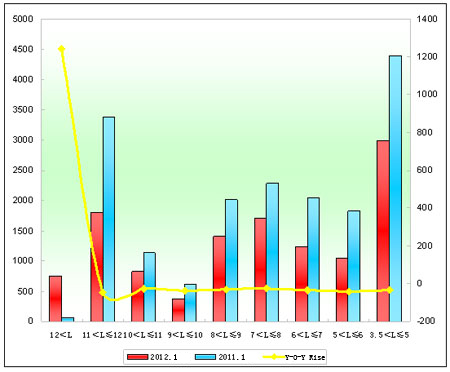
Chart 3: Seat Bus Sales Growth Chart of Different Lengths in January 2012
We can see from the above that:
Seat bus sales decrease 31.7% in January 2012. Sales of every length decrease except super large buses which increase 1243%. The decrease is mainly due to long spring festival holidays.
2. Xiamen King Long Seat Buses
Table 4: Xiamen King Long Seat Bus Sales Growth Table of Different Lengths in January 2012
|
|
Total |
12<L |
11<L≤12 |
10<L≤11 |
9<L≤10 |
|
2012.1 |
1670 |
6 |
305 |
145 |
59 |
|
2011.1 |
2383 |
7 |
378 |
136 |
73 |
|
Y-O-Y Rise
|
-42.7 |
-16.7 |
-23.9 |
6.2 |
-23.7 |
|
Industry Rise |
-31.7 |
1243 |
-46.6 |
-27.6 |
-39.4 |
|
8<L≤9 |
7<L≤8 |
6<L≤7 |
5<L≤6 |
3.5<L≤5 |
|
|
2012.1 |
215 |
73 |
32 |
38 |
797 |
|
2011.1 |
322 |
99 |
27 |
72 |
1269 |
|
Y-O-Y Rise
|
-33.2 |
-26.3 |
18.5 |
-47.2 |
-37.2 |
|
Industry Rise |
-30.1 |
-25.5 |
-32.3 |
-42.6 |
-32.1 |
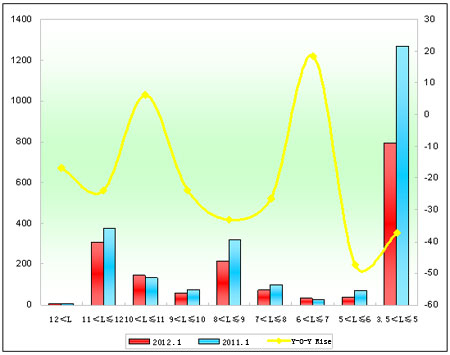
Table 4: Xiamen King Long Seat Bus Sales Growth Table of Different Lengths in January 2012
We can see from the above that:
(1) Sales of King Long seat buses decrease 42.7%, 19% more than its average, which means decrease of King Long seat buses speeds up, as the main reason of decrease of King Long buses.
(2) Only sales of 10-11 meters and 6-7 meters increase.
(3) Sales of China super large seat buses increase while sales of King Long decrease.
Source : www.chinabuses.org:
Editor : Chao
Views:3530


