Xiamen King Long Sales Data Analysis in January 2012 (I)
09 March 2012
www.chinabuses.org:I Bus Industry Sales Growth Analysis in January 2012
1. Overall Sales Growth Condition of Different Lengths
Table 1: Sales Growth Table of Different Lengths in January 2012
|
|
Total |
12<L |
11<L≤12 |
10<L≤11 |
9<L≤10 |
|
2012.1 |
17916 |
959 |
2870 |
1860 |
957 |
|
2011.1 |
23348 |
165 |
5229 |
2036 |
1128 |
|
Y-O-Y Rise
|
-23.3 |
481.2 |
-45.1 |
-8.6 |
-15.2 |
|
8<L≤9 |
7<L≤8 |
6<L≤7 |
5<L≤6 |
3.5<L≤5 |
|
|
2012.1 |
2153 |
2692 |
2181 |
1218 |
3026 |
|
2011.1 |
2738 |
3344 |
2350 |
1896 |
4462 |
|
Y-O-Y Rise
|
-21.3 |
-19.5 |
-7.2 |
-35.8 |
-32.2 |
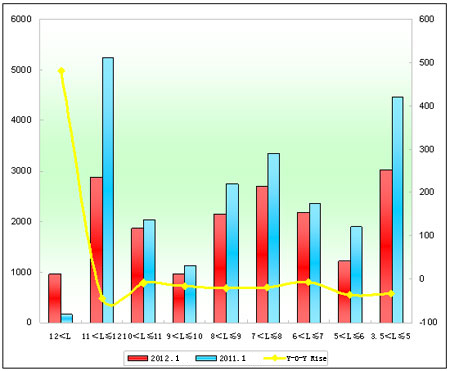
Chart 1: Sales Growth Chart of Different Lengths in January 2012
We can see from the above that:
Overall sales in January 2012 decrease 23.3% over 2011. Sales of every length decrease except super large buses. Sales of 11-12 meters decrease the most, then 5-6 meters, while sale of super large buses increase 481.2%. The decrease is mainly due to long spring festival holidays.
2. Xiamen King Long Sales Growth Analysis of Different Lengths
Table 2: Xiamen King Long Sales Growth Table of Different Lengths in January 2012
|
|
Total |
12<L |
11<L≤12 |
10<L≤11 |
9<L≤10 |
|
2012.1 |
2001 |
7 |
422 |
229 |
102 |
|
2011.1 |
2789 |
32 |
642 |
168 |
126 |
|
Y-O-Y Rise
|
-28.3 |
-78.1 |
-34.3 |
36.3 |
-19 |
|
Industry Rise |
-23.3 |
481.2 |
-45.1 |
-8.6 |
-15.2 |
|
8<L≤9 |
7<L≤8 |
6<L≤7 |
5<L≤6 |
3.5<L≤5 |
|
|
2012.1 |
298 |
76 |
32 |
38 |
797 |
|
2011.1 |
341 |
112 |
27 |
72 |
1269 |
|
Y-O-Y Rise
|
-12.6 |
-32.1 |
18.5 |
-47.2 |
-37.2 |
|
Industry Rise |
-21.3 |
-19.5 |
-7.2 |
-35.8 |
-32.2 |
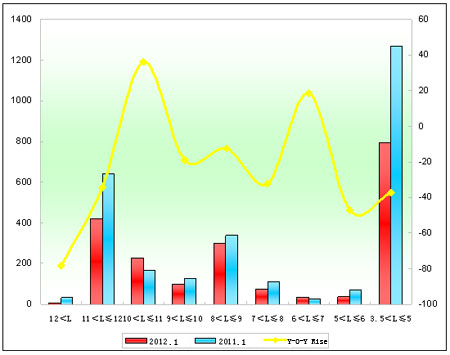
Chart 2: Xiamen King Long Sales Growth Chart of Different Lengths in January 2012
We can see from the above that:
(1) Sales of King Long buses in January 2012 decrease 788 units over last year, up to 28.3%, 5% more than industrial average, which means King Long slows down in January.
(2) Only sales of 10-11 meters and 6-7 meters increase.
Source : www.chinabuses.org:
Editor : Chao
Views:3773


