Suzhou Higer Sales Data Analysis in 2011 (II)
17 February 2012
www.chinabuses.org:II Seat Bus Sales Growth Analysis of Different Lengths in 2011
1. Industry Seat Bus Sales Growth Condition of Different Lengths
Table 3: Seat Bus Sales Growth Table of Different Lengths in 2011
|
|
Total |
12<L |
11<L≤12 |
10<L≤11 |
9<L≤10 |
|
2011 |
168413 |
500 |
29579 |
12153 |
6481 |
|
2010 |
144855 |
415 |
24657 |
11853 |
5147 |
|
Y-O-Y Rise
|
16.3 |
20.5 |
19.96 |
2.5 |
25.9 |
|
8<L≤9 |
7<L≤8 |
6<L≤7 |
5<L≤6 |
3.5<L≤5 |
|
|
2011 |
19581 |
24775 |
25694 |
17642 |
32008 |
|
2010 |
17001 |
23206 |
26018 |
23168 |
13390 |
|
Y-O-Y Rise
|
15.2 |
6.8 |
-1.2 |
-23.9 |
139 |
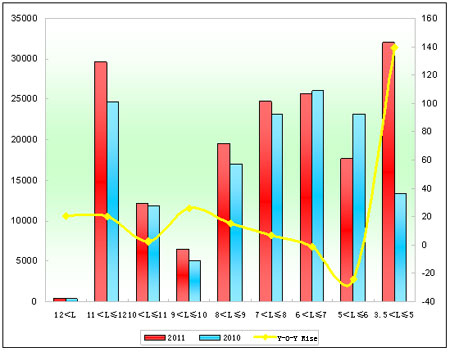
Chart 3: Seat Bus Sales Growth Chart of Different Lengths in 2011
We can see from the above that:
Seat bus sales increase 16.3% in 2011, 2% more than industrial average. From the lengths we can see that sales of every length increase except 5-6 meters and 6-7 meters. Sales of 3.5-5 meters bus increase the most, then super large bus.
2. Suzhou Higer Seat Buses
Table 4: Suzhou Higer Seat Bus Sales Growth Table of Different Lengths in 2011
|
|
Total |
12<L |
11<L≤12 |
10<L≤11 |
9<L≤10 |
|
2011 |
17064 |
195 |
4132 |
1920 |
512 |
|
2010 |
15184 |
58 |
3572 |
1867 |
288 |
|
Y-O-Y Rise
|
12.4 |
236.2 |
15.7 |
2.8 |
77.8 |
|
Industry Rise |
16.3 |
20.5 |
19.96 |
2.5 |
25.9 |
|
8<L≤9 |
7<L≤8 |
6<L≤7 |
5<L≤6 |
|
|
|
2011 |
3011 |
3192 |
942 |
3160 |
|
|
2010 |
2803 |
3507 |
651 |
2438 |
|
|
Y-O-Y Rise
|
7.4 |
-9 |
44.7 |
29.6 |
|
|
Industry Rise |
15.2 |
6.8 |
-1.2 |
-23.9 |
|
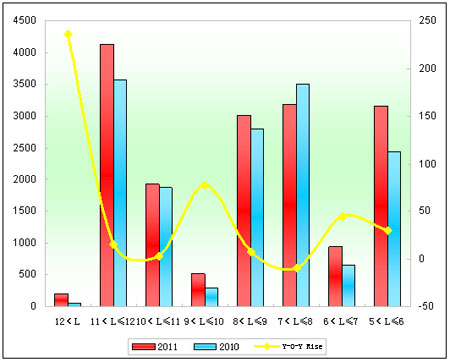
Table 4: Suzhou Higer Seat Bus Sales Growth Table of Different Lengths in 2011
We can see from the above that:
(1) Sales of Higer seat buses increase 12.4%, 0.3% less than industrial average, which means Higer seat bus market increases smoothly and it's not the main reason to promote Higer.
(2) Sales of super large seat buses increase 236.2%, much more than industrial average.
(3) As the only decreasing length, 7-8 meters buses slow Higer seat bus market down.
Source : www.chinabuses.org:
Editor : Chao
Views:4184


