Xiamen King Long Sales Data Analysis in 2011 (III)
09 February 2012
www.chinabuses.org:III City Bus Sales Growth Analysis of Different Lengths in 2011
1. Industry City Bus Sales Growth Condition of Different Lengths
Table 5: City Bus Sales Growth Table of Different Lengths in 2011
|
|
Total |
12<L |
11<L≤12 |
10<L≤11 |
9<L≤10 |
|
2011 |
69227 |
2096 |
16434 |
15708 |
6989 |
|
2010 |
62302 |
979 |
15026 |
14031 |
7599 |
|
Y-O-Y Rise
|
11.1 |
114.1 |
9.4 |
11.95 |
-8 |
|
8<L≤9 |
7<L≤8 |
6<L≤7 |
5<L≤6 |
3.5<L≤5 |
|
|
2011 |
10646 |
11675 |
3752 |
928 |
999 |
|
2010 |
9274 |
10052 |
2522 |
1966 |
853 |
|
Y-O-Y Rise
|
14.8 |
16.1 |
48.8 |
-52.8 |
17.1 |
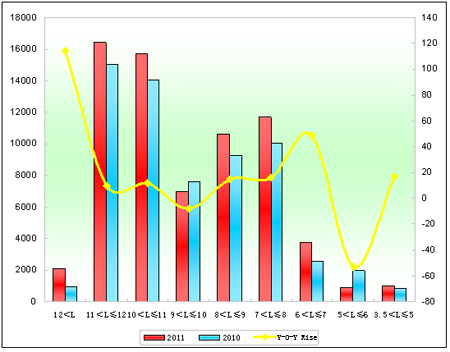
Chart 5: City Bus Sales Growth Chart of Different Lengths in 2011
We can see from the above that:
Sales of city buses increase by 11.1% in the first 12 months of 2011, which means national economic growth promotes city bus industry. From the lengths, except 5-6 meters and 9-10 meters, others are all positive growth.
2. Xiamen King Long City Buses
Table 6: Xiamen King Long City Bus Sales Growth Table of Different Lengths in 2011
|
|
Total |
12<L |
11<L≤12 |
10<L≤11 |
|
2011 |
4354 |
315 |
959 |
1616 |
|
2010 |
3793 |
47 |
917 |
1364 |
|
Y-O-Y Rise
|
14.8 |
570.2 |
4.6 |
18.5 |
|
Industry Rise |
11.1 |
114.1 |
9.4 |
11.95 |
|
9<L≤10 |
8<L≤9 |
7<L≤8 |
|
|
|
2011 |
402 |
649 |
413 |
|
|
2010 |
308 |
773 |
384 |
|
|
Y-O-Y Rise
|
30.5 |
-16 |
7.6 |
|
|
Industry Rise |
-8 |
14.8 |
16.1 |
|
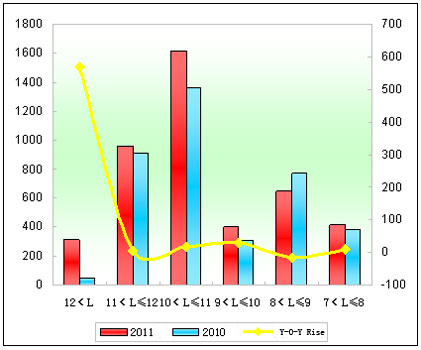
Chart 6: Xiamen King Long City Bus Sales Growth Chart of Different Lengths in 2011
We can see from the above that:
(1) Sales of Xiamen King Long city buses increase 14.8%, 3.7% more than industrial average, especially in super large, 10-11 meters and 9-10 meters, while sales of 8-9 meters buses decrease.
(2) Sales of super large buses increase 268 units, much more than industrial average.
Source : www.chinabuses.org:
Editor : Chao
Views:2856


