Zhengzhou Yutong Sales Data Analysis in the first 8 months of 2011 (I)
08 October 2011
www.chinabuses.org: I Bus Industry Sales Growth Analysis by Comparison of the first 8 Months of 2011 and 2010
1. Overall Sales Growth Condition of Different Lengths
Table 1: Sales Growth Table of Different Lengths in the first 8 Months of 2011
|
|
total |
12<L |
11<L≤12 |
10<L≤11 |
9<L≤10 |
|
the first 8 months of 2011 |
146157 |
1990 |
28756 |
17077 |
7596 |
|
the first months of 2010 |
127204 |
1057 |
25812 |
15300 |
7586 |
|
year-on-year rise
|
14.9 |
88.3 |
11.4 |
11.61 |
-0.13 |
|
8<L≤9 |
7<L≤8 |
6<L≤7 |
5<L≤6 |
3.5<L≤5 |
|
|
the first 8 months of 2011 |
17032 |
22294 |
17977 |
11816 |
21619 |
|
the first 8 months of 2010 |
16317 |
20082 |
17435 |
15495 |
8120 |
|
year-on-year rise
|
4.4 |
11 |
31.1 |
-23.7 |
166.2 |
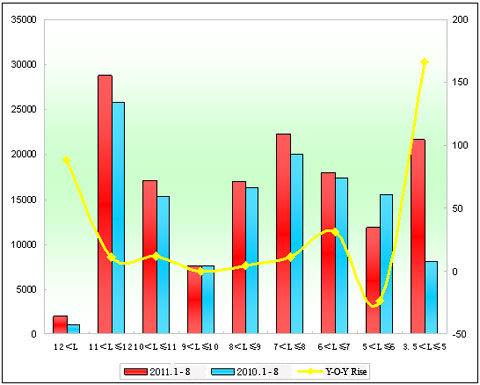
Chart 1: Sales Growth Chart of Different Lengths in the first 8 Months of 2011
We can see from the above that:
Overall sales in the first 8 months of 2011 increase 14.9%. From the lengths we can see that sales of every length grow except 9-10 meters and 5-6 meters and it is the 8th consecutive growth with the expanding tendency of growth amplitude. The max growth is 3.5-5 meters bus; then over-12-meter super large bus, up to 88.3%, then 6-7 meters bus. Sales of 5-6 meters rural bus decrease the most.
2. Zhengzhou Yutong Sales Growth Analysis of Different Lengths
Table 2: Zhengzhou Yutong Sales Growth Table of Different Lengths in the first 8 Months of 2011
|
|
total |
12<L |
11<L≤12 |
10<L≤11 |
|
the first 8 months of 2011 |
26858 |
514 |
8043 |
2895 |
|
the first 8 months of 2010 |
23507 |
186 |
6904 |
2669 |
|
year-on-year rise
|
14.3 |
176.3 |
16.5 |
8.5 |
|
industry rise |
14.9 |
88.3 |
11.4 |
11.61 |
|
9<L≤10 |
8<L≤9 |
7<L≤8 |
6<L≤7 |
|
|
the first 8 months of 2011 |
1743 |
5550 |
5977 |
2136 |
|
the first 8 months of 2010 |
1798 |
4500 |
4963 |
2487 |
|
year-on-year rise
|
-3.1 |
23.3 |
20.4 |
-14.1 |
|
industry rise |
-0.13 |
4.4 |
11 |
31.1 |
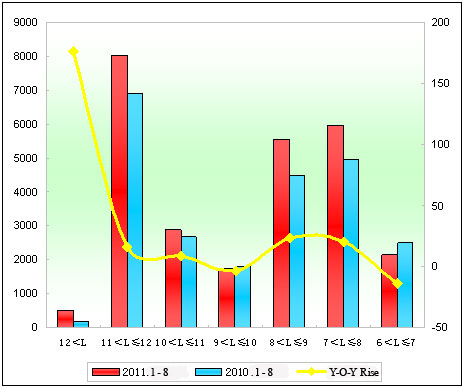
Chart 2: Zhengzhou Yutong Sales Growth Chart of Different Lengths in the first 8 Months of 2011
We can see from the above that:
(1) Sales of Yutong bus in the first 8 months of 2011 increase 14.3%, 0.6% less than industrial average.
(2) Except 9-10 meters and 6-7 meters, sales of other lengths of Yutong bus increase, especially super large bus, then 8-9 meters, and then 7-8 meters.
(3) Sales of Yutong super large buses increase 176.3% while industrial average is 88.3%, which lives up to the leading role of Yutong in bus industry.
(4) 11-12 meters buses are sold 28756 units including 8043 units of Yutong buses, accounting for 28% which means Yutong is unrivaled in large buses.
II Seat Bus Sales Growth Analysis of Different Lengths by Comparison of the first 8 months of 2011 and 2010
1. Industry Seat Bus Sales Growth Condition of Different Lengths
Table 3: Seat Bus Sales Growth Table of Different Lengths in the first 8 Months of 2011
|
|
total |
12<L |
11<L≤12 |
10<L≤11 |
9<L≤10 |
|
the first 8 months of 2011 |
102630 |
355 |
16919 |
7730 |
3563 |
|
the first 8 months of 2010 |
88238 |
243 |
15273 |
7245 |
3139 |
|
year-on-year rise
|
16.3 |
46.1 |
10.8 |
6.7 |
13.5 |
|
8<L≤9 |
7<L≤8 |
6<L≤7 |
5<L≤6 |
3.5<L≤5 |
|
|
the first 8 months of 2011 |
11340 |
14919 |
15780 |
10986 |
21038 |
|
the first 8 months of 2010 |
10557 |
14427 |
15610 |
14084 |
7660 |
|
year-on-year rise
|
7.4 |
3.4 |
1.1 |
-22 |
174.6 |
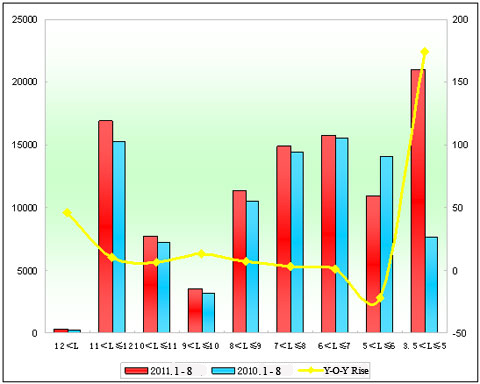
Chart 3: Seat Bus Sales Growth Chart of Different Lengths in the first 8 Months of 2011
We can see from the above that:
Seat bus sales increase 16.3% in the first 8 months of 2011, a bit more than the industrial average. From the lengths we can see that sales of every length increase except 5-6 meters, which means rural seat bus market is shrinking. Sales of 3.5-5 meters bus increase the most, then super large bus, and then 9-10 meters. The minimum growth is in 6-7 meters, then 7-8 meters. Apparently, seat bus is the major force of bus market growth in the first 8 months of 2011.
2. Zhengzhou Yutong Seat Buses
Table 4: Zhengzhou Yutong Seat Bus Sales Growth Table of Different Lengths in the first 8 Months of 2011
|
|
total |
12<L |
11<L≤12 |
10<L≤11 |
|
the first 8 months of 2011 |
19533 |
76 |
5291 |
2077 |
|
the first 8 months of 2010 |
17748 |
80 |
4357 |
1876 |
|
year-on-year rise
|
10.1 |
-5 |
21.4 |
10.7 |
|
industry rise |
16.3 |
46.1 |
10.8 |
6.7 |
|
9<L≤10 |
8<L≤9 |
7<L≤8 |
6<L≤7 |
|
|
the first 8 months of 2011 |
1291 |
3958 |
4705 |
2135 |
|
the first 8 months of 2010 |
1312 |
3509 |
4127 |
2487 |
|
year-on-year rise
|
-1.6 |
12.8 |
14 |
-14.2 |
|
industry rise |
13.5 |
7.4 |
3.4 |
1.1 |
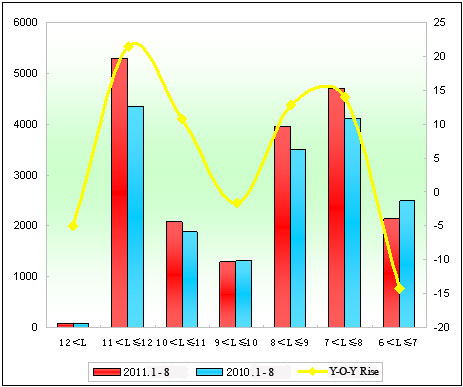
Chart 4: Zhengzhou Yutong Seat Bus Sales Growth Chart of Different Lengths in the first 8 Months of 2011
We can see from the above that:
(1) Sales of Yutong Seat Buses increase 10.1%, 6% less than industrial average, which is 14.3%, therefore, the sales growth of Yutong is due to city buses instead of seat buses.
(2) Analysis of growth tendency of every length: negative growth of three lengths and positive growth of four lengths. The max growth is in 11-12 meters and the minimum growth is in 10-11 meters; the max decrease is in 6-7 meters and the minimum decrease is in 9-10 meters.
Source : www.chinabuses.org:
Editor : Chao
Views:4786


