Analysis of Sales Data of Yutong Bus in Jan.-July 2011 Ⅱ
05 September 2011
Analysis of Sales Growth of City Buses in Various Lengths in Jan.-July 2011 and Jan.-July 2010
1.The Sales Growth of City Buses in Various Lengths for the Bus Industry
|
|
Total |
12<L |
11<L≤12 |
10<L≤11 |
9<L≤10 |
|
Jan.-July 2011 |
34921 |
1345 |
8489 |
7931 |
3336 |
|
Jan.-July 2010 |
30907 |
846 |
6657 |
6843 |
3816 |
|
year-on-year growth
|
13 |
59 |
27.5 |
15.9 |
-12.6 |
|
8<L≤9 |
7<L≤8 |
6<L≤7 |
5<L≤6 |
|
|
|
Jan.-July 2011 |
4590 |
6349 |
1918 |
439 |
|
|
Jan.-July 2010 |
5093 |
4793 |
1384 |
1037 |
|
|
year-on-year growth
|
-9.9 |
32.5 |
38.6 |
-57.7 |
|
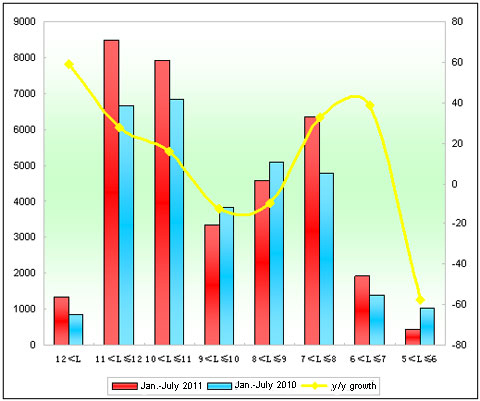
Chart 5: Sales Growth Statistics Chart of City Buses in various lengths for buses in Jan.-July 2011
Shown above,
The sales of city buses increases 13% in Jan.-July 2011. In lengths, the sales of 9-10 meter, 8-9 meter and 5-6 meter decrease while others increase. In particular, the biggest fall is shown at 5-6 meter falls and the biggest growth at the extra large buses.
2.Yutong City Buses
Table 6: Sales Growth Statistics Table of Yutong City Buses in various lengths for buses in Jan.-July 2011 and Jan.-July 2010
|
|
Total |
12<L |
11<L≤12 |
10<L≤11 |
|
Jan.-July 2011 |
5308 |
347 |
1523 |
710 |
|
Jan.-July 2010 |
3952 |
70 |
1242 |
691 |
|
year-on-year growth
|
34.3 |
395.7 |
22.6 |
2.75 |
|
industry growth |
13 |
59 |
27.5 |
15.9 |
|
9<L≤10 |
8<L≤9 |
7<L≤8 |
|
|
|
Jan.-July 2011 |
361 |
1263 |
1103 |
|
|
Jan.-July 2010 |
405 |
829 |
715 |
|
|
year-on-year growth
|
-10.86 |
148.9 |
54.3 |
|
|
industry growth |
-12.6 |
-9.9 |
32.5 |
|
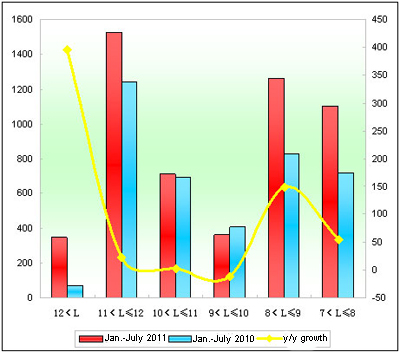
Chart 6: Sales Growth Statistics Chart of Yutong City Buses in various lengths for buses in Jan.-July 2011 and Jan.-July 2010
Shown above,
① The sales of Yutong city buses grow 34.3%, 31 percentage higher than the bus industry. It indicates that the sales growth of city buses mainly leads to the overall growth.
② The sales volume of 11-12 meter city buses increase 281 units, 22.6% up, 5 percentage higher than the bus industry; of extra large city buses increase 277 units, 395.7% up while 59% up in the bus industry.
③ It seems the decreasing trend of the sales of 9-10 meter city buses. The biggest growth rate is shown at 8-9 meter, 148.9% up (434 units more), almost 160 percentage higher than the bus industry.
Analysis of Sales Growth of Sleeper Buses in Various Lengths in Jan.-July 2011 and Jan.-July 2010
The Sales Growth of Sleeper Buses in Various Lengths for the Bus Industry
|
|
Total |
12<L |
11<L≤12 |
10<L≤11 |
|
Jan.-July 2011 |
1760 |
87 |
1662 |
11 |
|
Jan.-July 2010 |
1907 |
98 |
1793 |
16 |
|
year-on-year growth |
-7.7 |
-11.2 |
-7.3 |
-31.3 |
Yutong Sleeper Buses
Sales Growth Statistics Table of Yutong Sleeper Buses in various lengths for buses in Jan.-July 2011
|
|
Total |
12<L |
11<L≤12 |
|
Jan.-July 2011 |
1007 |
37 |
970 |
|
Jan.-July 2010 |
989 |
26 |
963 |
|
year-on-year growth |
1.8 |
42.3 |
0.73 |
|
industry growth |
-7.7 |
-11.2 |
-7.3 |
Shown above,
Yutong Bus takes the monopoly position in the sleeper bus industry, selling 1007 units, 1.8% up in Jan.-July 2011, which accounts for 57.2% market shares.
① The sales volume of sleeper buses is 1760 units in the bus industry. Yutong Bus sells 989 units, taking 51.9% market shares in Jan.-July 2010.
② The sales volume of the sleeper buses above 12-meter is 37 units, 42.3% up (11 units more) than Jan.-July 2010.
Source : www.chinabuses.org
Editor : Andrea
Views:4219


