Analysis of Sales Data of Higer Bus in Jan.-July 2011 Ⅰ
24 August 2011
Analysis of Sales Growth of Bus Industry in Jan.-July 2011 and Jan. -July 2010
1. Sales Growth in Various Lengths
Table 1: Sales Growth Statistics Table in various lengths for buses in Jan.-July 2011
|
|
Total |
12<L |
11<L≤12 |
10<L≤11 |
9<L≤10 |
|
Jan.-July 2011 |
124226 |
1739 |
24561 |
14236 |
6448 |
|
Jan.-July 2010 |
108939 |
1132 |
21298 |
13135 |
6409 |
|
year-on-year growth
|
14 |
53.6 |
15.3 |
8.4 |
0.6 |
|
8<L≤9 |
7<L≤8 |
6<L≤7 |
5<L≤6 |
3.5<L≤5 |
|
|
Jan.-July 2011 |
14362 |
19037 |
15515 |
10038 |
18290 |
|
Jan.-July 2010 |
14153 |
17369 |
14998 |
13664 |
6781 |
|
year-on-year growth
|
1.5 |
9.6 |
3.4 |
-26.5 |
169.7 |

Chart 1: Sales Growth Statistics Table in various lengths for buses in Jan.-July 2011
Shown above,
The sales goes up 14.0% in Jan.-July 2011 than Jan.-July 2010. In lengths, the sales of buses show positive growth at all lenghts except the buses with 5-6 meter. The biggest growth show at 3.5-5 meter (169.7%) and extra large buses (53.6%), 11-12 meter (15.3%) and 9-10 meter (0.6%).
2. Analysis of Sales Growth of Higer Bus in Various Lengths
Table 2: Sales Growth Statistics Table of Higer Bus in various lengths for buses in Jan. -July 2011
|
|
Total |
12<L |
11<L≤12 |
10<L≤11 |
9<L≤10 |
|
Jan.-July 2011 |
12469 |
109 |
3362 |
1907 |
763 |
|
Jan.-July 2010 |
10966 |
38 |
2675 |
1907 |
393 |
|
year-on-year growth
|
13.7 |
186.8 |
25.7 |
0 |
94.1 |
|
industry growth |
14 |
53.6 |
15.3 |
8.4 |
0.6 |
|
8<L≤9 |
7<L≤8 |
6<L≤7 |
5<L≤6 |
|
|
|
Jan.-July 2011 |
2101 |
2195 |
560 |
1472 |
|
|
Jan.-July 2010 |
2164 |
2267 |
143 |
1379 |
|
|
year-on-year growth
|
-2.9 |
-3.2 |
291.6 |
6.7 |
|
|
industry growth |
1.5 |
9.6 |
3.4 |
-26.5 |
|
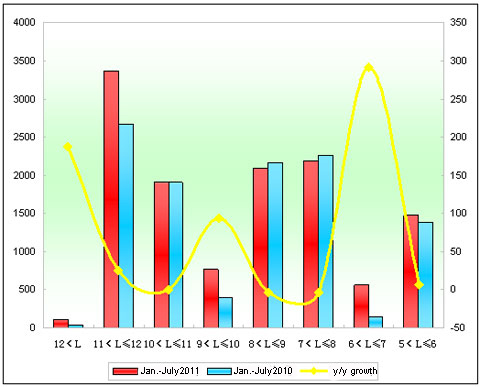
Chart 2: Sales Growth Statistics Table of Higer Bus in various lengths for buses in Jan-July 2011
Shown above,
①The sales growth rate of Higer Bus is 13.7% in Jan.-July 2011, almost 0.3 percentage lower than the growth speed of the industry. The sales of extra large buses increase 186.8%, of 11-12 meter grow 25.7%.
②The sales of 10-11 meter buses remain the same level as before.
Analysis of Sales Growth of Seat Buses in Jan.-July 2011 and Jan.-July 2010
1. Sales Growth of Seat Buses in the Bus Industry
Table 3: Sales Growth Statistics Table of Seats Buses in various lengths for buses in Jan.-July 2011
|
|
Total |
12<L |
11<L≤12 |
10<L≤11 |
9<L≤10 |
|
Jan.-July 2011 |
87076 |
274 |
14408 |
6294 |
3045 |
|
Jan.-July 2010 |
75727 |
187 |
12848 |
6276 |
2557 |
|
year-on-year growth
|
15 |
46.5 |
12.1 |
0.29 |
19.1 |
|
8<L≤9 |
7<L≤8 |
6<L≤7 |
5<L≤6 |
3.5<L≤5 |
|
|
Jan.-July 2011 |
9762 |
12639 |
13565 |
9329 |
17760 |
|
Jan.-July 2010 |
9048 |
12551 |
13449 |
12468 |
6343 |
|
year-on-year growth
|
7.9 |
0.7 |
0.86 |
-26.2 |
180 |

Chart 3: Sales Growth Statistics Table of Seats Buses in various lengths for buses in Jan.-July 2011
Shown above,
The sales goes up 15% for seat buses in Jan.-July 2011, 1 percentage higher than the growth speed of the bus industry. In lengths, it reduces in 5-6m and shows the positive growth at others, in particular, 3.5-5 meter light buses.
Source : www.chinabuses.org
Editor : Andrea
Views:3629


