Analysis of Sales Data of Higer Bus in Jan.-May 2011 Ⅱ
04 July 2011
Table 4: Sales Growth Statistics Table of Higer Seat Buses in various lengths for buses in Jan.-May 2011
|
|
Total |
12<L |
11<L≤12 |
10<L≤11 |
9<L≤10 |
|
Jan.-May 2011 |
6172 |
76 |
1385 |
641 |
227 |
|
Jan.-May 2010 |
5694 |
20 |
1290 |
684 |
76 |
|
year-on-year growth
|
8.4 |
280 |
7.4 |
-6.3 |
198.7 |
|
industry growth |
14.7 |
40.5 |
9.7 |
2.7 |
37 |
|
8<L≤9 |
7<L≤8 |
6<L≤7 |
5<L≤6 |
|
|
|
Jan.-May 2011 |
1068 |
1289 |
550 |
936 |
|
|
Jan.-May 2010 |
1094 |
1396 |
126 |
1008 |
|
|
year-on-year growth
|
-2.4 |
-7.7 |
336.5 |
-7.1 |
|
|
industry growth |
3.4 |
-6 |
-2.98 |
-26.9 |
|
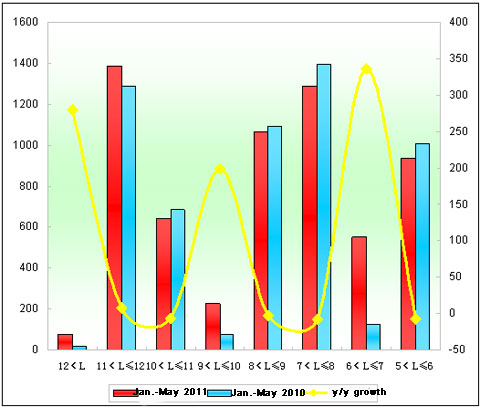
Chart 4: Sales Growth Statistics Chart of Higer Seat Buses in various lengths for buses in Jan.-May 2011
Shown above,
① The sales of Higer Bus seat buses increases 8.4%, almost 12.5 percentage less than the growth rate of the bus industry, however, almost 6 percentage less than that of its general bus market. It indicates that the growth of Higer seat buses is not the main factor for that of Higer Bus in Jan.-May 2011.
②The growth of Higer 11-12 meter seat buses reaches 7.4% in Jan.-May 2011 and the sales growth of extra large buses is far more higher than the industry, 9-10 meter (almost 200% up), 6-7 meter (negative growth in the industry for the same length). The sales decreasing show at 10-11m, 5-6m, and 7-8m.
Analysis of Sales Growth of City Buses in Various Lengths in Jan.-May 2011 and Jan.-May 2010
1.The Sales Growth of City Buses in Various Lengths for the Bus Industry
Table 5: Sales Growth Statistics Table of City Buses in various lengths for buses in Jan.-May 2011 and Jan.-May 2010
|
|
Total |
12<L |
11<L≤12 |
10<L≤11 |
9<L≤10 |
|
Jan.-May 2011 |
21400 |
892 |
5250 |
4891 |
2320 |
|
Jan.-May 2010 |
21270 |
353 |
4672 |
4277 |
2531 |
|
year-on-year growth
|
0.61 |
152.7 |
12.4 |
14.4 |
-8.3 |
|
8<L≤9 |
7<L≤8 |
6<L≤7 |
5<L≤6 |
3.5<L≤5 |
|
|
Jan.-May 2011 |
2596 |
3945 |
1025 |
207 |
274 |
|
Jan.-May 2010 |
3731 |
3493 |
1052 |
830 |
331 |
|
year-on-year growth
|
-30.4 |
12.9 |
-2.6 |
-75.1 |
-17.2 |
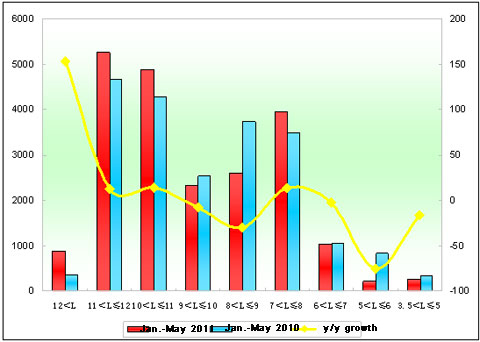
Chart 5: Sales Growth Statistics Chart of City Buses in various lengths for buses in Jan.-May 2011
Shown above,
The sales of city buses increases 0.61% in Jan.-May 2011. In lengths, the sales of 9-10 meter, 8-9 meter and 5-6 meter, 6-7meter, 3.5-5 meter decrease, in particular 8-9 meter while increase at other length.
2.Higer City Buses
Table 6: Sales Growth Statistics Table of Higer City Buses in various lengths for buses in Jan.-May 2011 and Jan.-May 2010
|
|
Total |
12<L |
11<L≤12 |
10<L≤11 |
|
Jan.-May 2011 |
2306 |
13 |
677 |
586 |
|
Jan.-May 2010 |
1852 |
6 |
343 |
664 |
|
year-on-year growth
|
24.5 |
116.7 |
97.4 |
-11.7 |
|
industry growth |
6.1 |
152.7 |
12.4 |
14.4 |
|
9<L≤10 |
8<L≤9 |
7<L≤8 |
|
|
|
Jan.-May 2011 |
351 |
358 |
321 |
|
|
Jan.-May 2010 |
184 |
406 |
249 |
|
|
year-on-year growth
|
90.8 |
-11.8 |
28.9 |
|
|
industry growth |
-8.3 |
-30.4 |
12.9 |
|
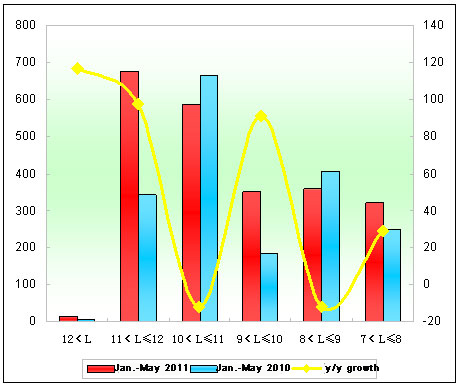
Chart 6: Sales Growth Statistics Chart of Higer City Buses in various lengths for buses in Jan.-May 2011 and Jan.-May 2010
Shown above,
①The sales of Higer city buses increases 24.5% (454 units more than in Jan.-May 2010) in Jan.-May 2011. The growth of city buses contribute to the sales increasing of Higer Bus.
②The main growth shows at extra large, 11-12 meter, 9-10 meter, 7-8 meter, especially the growth rate of 11-12 meter and 9-10 meter are far higher than that of the bus industry.
③The sales decreasing show at 8-9 meter and 10-11 meter.
Source : www.chinabuses.org
Editor : Andrea
Views:3049


