Analysis of Sales Data of Higer Bus in Jan.-May 2011 Ⅰ
27 June 2011
Analysis of Sales Growth of Bus Industry in Jan.-May 2011 and Jan. -May 2010
1. Sales Growth in Various Lengths
Table 1: Sales Growth Statistics Table in various lengths for buses in Jan.-May 2011
|
|
Total |
12<L |
11<L≤12 |
10<L≤11 |
9<L≤10 |
|
Jan.-May 2011 |
82536 |
1151 |
16026 |
9207 |
4405 |
|
Jan.-May 2010 |
74779 |
556 |
14642 |
8483 |
4044 |
|
year-on-year growth
|
10.4 |
107 |
9.6 |
8.5 |
8.9 |
|
8<L≤9 |
7<L≤8 |
6<L≤7 |
5<L≤6 |
3.5<L≤5 |
|
|
Jan.-May 2011 |
9106 |
12406 |
10147 |
6789 |
13299 |
|
Jan.-May 2010 |
10104 |
12458 |
10532 |
9609 |
4351 |
|
year-on-year growth
|
-9.9 |
-0.42 |
-3.7 |
-29.3 |
205.7 |
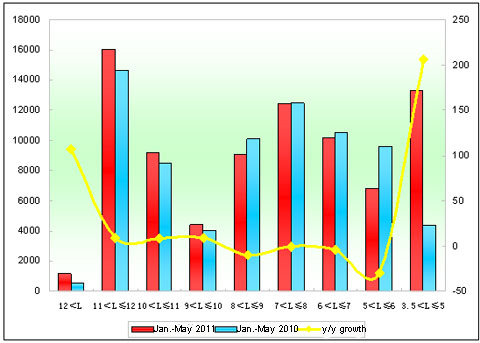
Chart 1: Sales Growth Statistics Table in various lengths for buses in Jan.-May 2011
Shown above,
The sales goes up 10.4% in Jan.-May 2011 than Jan.-May 2010. In lengths, the sales of buses above 9-meter increase while the buses below 9-meter decrease (3.5-5 meter no included). The biggest growth show at 3.5-5 meter(225.6%).
2. Analysis of Sales Growth of Higer Bus in Various Lengths
Table 2: Sales Growth Statistics Table of Higer Bus in various lengths for buses in Jan. -May 2011
|
|
Total |
12<L |
11<L≤12 |
10<L≤11 |
9<L≤10 |
|
Jan. -May 2011 |
8550 |
89 |
2134 |
1227 |
578 |
|
Jan. -May 2010 |
7629 |
27 |
1715 |
1348 |
260 |
|
year-on-year growth
|
12.1 |
229.6 |
24.4 |
-9 |
122.3 |
|
industry growth |
10.4 |
107 |
9.6 |
8.5 |
8.9 |
|
8<L≤9 |
7<L≤8 |
6<L≤7 |
5<L≤6 |
|
|
|
Jan. -May 2011 |
1426 |
1610 |
550 |
936 |
|
|
Jan. -May 2010 |
1500 |
1645 |
126 |
1008 |
|
|
year-on-year growth
|
-4.9 |
-2.1 |
336.5 |
-7.1 |
|
|
industry growth |
-9.9 |
-0.42 |
-3.7 |
-29.3 |
|
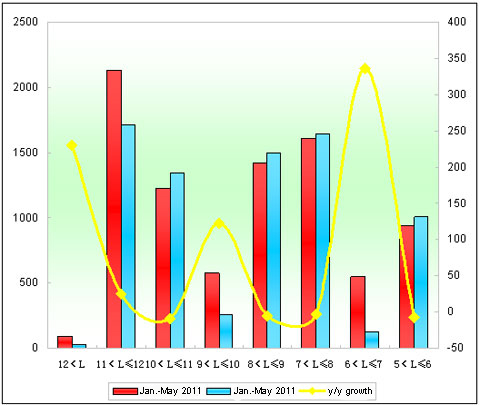
Chart 2: Sales Growth Statistics Table of Higer Bus in various lengths for buses in Jan-May 2011
Shown above,
①The sales growth rate of Higer Bus is 12.1% in Jan.-May 2011, almost 2 percentage higher than the growth speed of the industry. The sales growth mainly show at 6-7 meter, 9-10 meter and 11-12 meter buses. Although the sales of extra large buses grow fast, the base is slow.
②It sells 89 extra large buses in Jan.-May 2011, 62 more units than in Jan.-May 2010 (229.6% up), far (almost 120 percentage) more than the industry growth.
Analysis of Sales Growth of Seat Buses in Jan.-May 2011 and Jan.-May 2010
1. Sales Growth of Seat Buses in the Bus Industry
Table 3: Sales Growth Statistics Table of Seats Buses in various lengths for buses in Jan.-May 2011
|
|
Total |
12<L |
11<L≤12 |
10<L≤11 |
9<L≤10 |
|
Jan.-May 2011 |
59500 |
184 |
9578 |
4308 |
2041 |
|
Jan.-May 2010 |
51876 |
131 |
8734 |
4195 |
1490 |
|
year-on-year growth
|
14.7 |
40.5 |
9.7 |
2.7 |
37 |
|
8<L≤9 |
7<L≤8 |
6<L≤7 |
5<L≤6 |
3.5<L≤5 |
|
|
Jan.-May 2011 |
6500 |
8416 |
9090 |
6358 |
13025 |
|
Jan.-May 2010 |
6288 |
8949 |
9369 |
8700 |
4020 |
|
year-on-year growth
|
3.4 |
-6 |
-2.98 |
-26.9 |
224 |
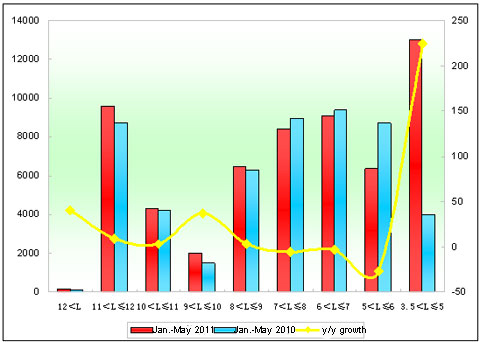
Chart 3: Sales Growth Statistics Table of Seats Buses in various lengths for buses in Jan.-May 2011
Shown above,
The sales goes up 14.7% for seat buses in Jan.-May 2011 while 69.1% in Jan.-May 2010. In lengths, it reduces in 5-6m, 7-8m and 6-7m and the big growth shows at extra large, 9-10m and 3.5-5m.
Source : www.chinabuses.org
Editor : Andrea
Views:3206


