Analysis of Sales Data of Yutong Bus in Jan.-Mar.2011 Ⅱ
28 April 2011
Analysis of Sales Growth of City Buses in Various Lengths in Jan.-Mar. 2011
1. The Sales Growth of City Buses in Various Lengths for the Bus Industry
Table 5: Sales Growth Statistics Table of City Buses in various lengths for buses in Jan.-Mar. 2011
|
|
Total |
12<L |
11<L≤12 |
10<L≤11 |
9<L≤10 |
|
Jan.-Mar.2011 |
11286 |
309 |
3162 |
2406 |
1251 |
|
Jan.-Mar.2010 |
11561 |
63 |
3023 |
1933 |
1208 |
|
year-on-year growth
|
-2.4 |
39.05 |
4.6 |
24.5 |
3.6 |
|
8<L≤9 |
7<L≤8 |
6<L≤7 |
5<L≤6 |
3.5<L≤5 |
|
|
Jan.-Mar.2011 |
1293 |
2123 |
498 |
87 |
157 |
|
Jan.-Mar.2010 |
2473 |
1691 |
621 |
411 |
138 |
|
year-on-year growth
|
-47.7 |
25.5 |
-19.8 |
-78.8 |
13.8 |

Chart 5: Sales Growth Statistics Chart of City Buses in various lengths for buses in Jan.-Mar. 2011
Shown above,
The sales of city buses increases -2.4% in Jan.-Mar.2011. The development of the market segments is unbalanced, resulting in the decreasing growth of city buses in this quarter.
2. Yutong City Buses
Table 6: Sales Growth Statistics Table of Yutong City Buses in various lengths for buses in Jan.-Mar. 2011
|
|
Total |
12<L |
11<L≤12 |
10<L≤11 |
|
Jan.-Mar. 2011 |
1515 |
174 |
555 |
113 |
|
Jan.-Mar. 2010 |
1121 |
0 |
387 |
104 |
|
year-on-year growth |
35.1 |
100 |
43.4 |
8.7 |
|
industry growth |
-2.4 |
39.05 |
4.6 |
24.5 |
|
9<L≤10 |
8<L≤9 |
7<L≤8 |
|
|
|
Jan.-Mar. 2011 |
168 |
185 |
320 |
|
|
Jan.-Mar. 2010 |
33 |
289 |
308 |
|
|
year-on-year growth |
409.1 |
-36 |
3.9 |
|
|
industry growth |
3.6 |
-47.7 |
25.5 |
|
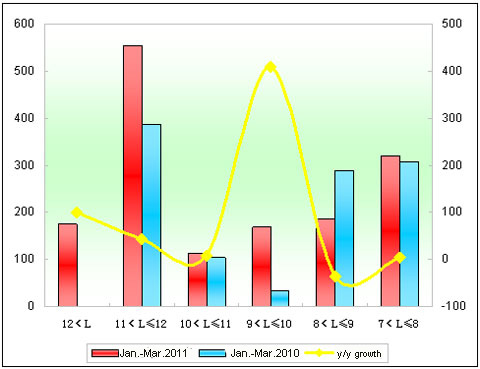
Chart 6: Sales Growth Statistics Chart of Yutong City Buses in various lengths for buses in Jan.-Mar. 2011
Shown above,
① The sales of Yutong city buses increases 35.1%, almost 37.5 percentage higher than that of the industry in Jan.-Mar.2011. The main growth shows at 11-12 meter (43.4%) and extra large buses (174 more units) while zero in the first quarter 2010.
② The increasing rate of 9-10m buses is far higher than the industry.
③ The growth rate of 7-8m, 8-9m and 10-11m is much less than that of the industry.
Analysis of Sales Growth of Sleeper Buses in Various Lengths in Jan.-Mar. 2011 and Jan.-Mar. 2010
1. Analysis of Sales Growth of Sleeper Buses in Various Lengths
Sales Growth Statistics Table of Sleeper Buses in various lengths for buses in Jan.-Mar.2011
|
|
Total |
12<L |
11<L≤12 |
10<L≤11 |
|
Jan.-Mar. 2011 |
997 |
48 |
944 |
5 |
|
Jan.-Mar. 2010 |
964 |
58 |
897 |
9 |
|
year-on-year growth |
3.4 |
-17.2 |
5.2 |
-44.4 |
2. Yutong Sleeper Buses
Sales Growth Statistics Table of Yutong Sleeper Buses in various lengths for buses in Jan.-Mar.2011
|
|
Total |
12<L |
11<L≤12 |
|
Jan.-Mar. 2011 |
623 |
27 |
596 |
|
Jan.-Mar. 2010 |
482 |
14 |
468 |
|
year-on-year growth |
29.3 |
92.9 |
19.7 |
|
industry growth |
-16.5 |
-24.5 |
-15.7 |
Shown above,
Yutong Bus donomates the sleeper bus market with the sales volume of 623 units (29.3% up) in the first quarter, taking 62.5% market shares.
①In the first quarter 2010, the sales volume of Yutong sleeper buses is 964 units, accounting for 50.0% of market shares.
②The main growth of Yutong sleeper buses is shown at 11-12m buses. It sold 27 sleeper buses over 12-meter, 13 units more than that in the same peoriod of 2010.
Source : www.chinabuses.org
Editor : Lena
Views:4247


