Analysis of Sales Data of Higer Bus in Jan.-Feb. 2011 Ⅰ
28 March 2011
Analysis of Sales Growth of Bus Industry in Jan.-Feb. 2011 and Jan. -Feb. 2010
1. Sales Growth in Various Lengths
Table 1: Sales Growth Statistics Table in various lengths for buses in Jan.-Feb. 2011
|
|
Total |
12<L |
11<L≤12 |
10<L≤11 |
9<L≤10 |
|
Jan.-Feb.2011 |
30743 |
272 |
6507 |
2925 |
1476 |
|
Jan.-Feb.2010 |
27169 |
149 |
6078 |
2997 |
1085 |
|
year-on-year growth
|
13.2 |
82.6 |
7.1 |
-2.4 |
36 |
|
8<L≤9 |
7<L≤8 |
6<L≤7 |
5<L≤6 |
3.5<L≤5 |
|
|
Jan.-Feb.2011 |
3091 |
4328 |
3298 |
2504 |
6334 |
|
Jan.-Feb.2010 |
4348 |
4633 |
3631 |
2762 |
1486 |
|
year-on-year growth
|
-28.9 |
-6.6 |
-9.2 |
-9.3 |
326.2 |
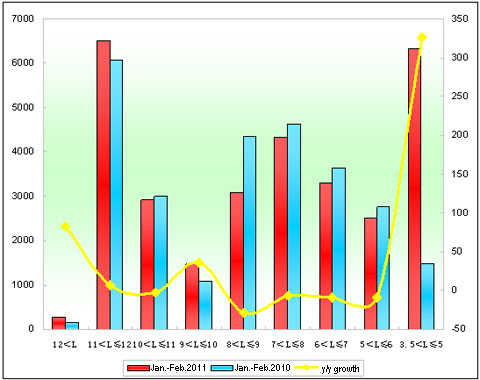
Chart 1: Sales Growth Statistics Table in various lengths for buses in Jan.-Feb. 2011
Shown above,
The sales goes up 13.2% in Jan.-Feb.2011 than Jan.-Feb.2010. In lengths, the sales of buses in all lengths (10-11m,7-8m,8-9m and 6-7m excluded) increase. The biggest growth show at 3.5-5 meter(326.3%),and then 9-10 meter nand the smallest growth at 8-9 meter and then 6-7m buses.
2. Analysis of Sales Growth of Higer Bus in Various Lengths
Table 2: Sales Growth Statistics Table of Higer Bus in various lengths for buses in Jan. 2011
|
|
Total |
12<L |
11<L≤12 |
10<L≤11 |
9<L≤10 |
|
Jan.-Feb.2011 |
2553 |
12 |
549 |
313 |
129 |
|
Jan.-Feb.2010 |
2911 |
6 |
745 |
489 |
82 |
|
y/y growth
|
-12.3 |
100 |
-26.3 |
-36 |
57.3 |
|
industry growth |
13.2 |
82.6 |
7.1 |
-2.4 |
36 |
|
8<L≤9 |
7<L≤8 |
6<L≤7 |
5<L≤6 |
|
|
|
Jan.-Feb.2011 |
563 |
529 |
188 |
270 |
|
|
Jan.-Feb.2010 |
614 |
688 |
48 |
239 |
|
|
y/y growth
|
-8.3 |
-23.1 |
291.7 |
13 |
|
|
industry growth |
-28.9 |
-6.6 |
-9.2 |
-9.3 |
|
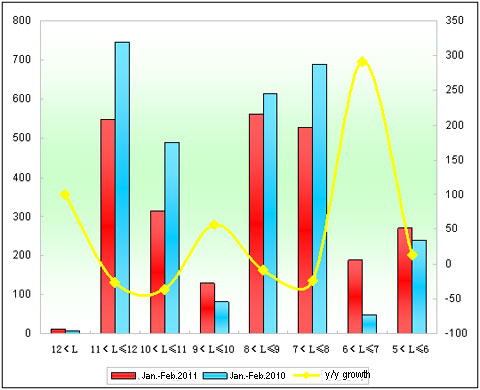
Chart 2: Sales Growth Statistics Table of Higer Bus in various lengths for buses in Jan-Feb. 2011
Shown above,
①The sales growth rate of Higer Bus is -12.3% in Jan.-Feb.2011, almost 25.5 percentage lower than the growth speed of the industry. However, the sales growth of Higer extra large buses, 10-11m, 9-10m, 6-7m buses is higher than that of the bus industry while 11-12m, and 7-8m products is lower than the industry.
②It sells 12 extra large buses in Jan.-Feb.2011, 6 more units than in Jan.-Feb.2010 (6 units).
Analysis of Sales Growth of Seat Buses in Jan.-Feb. 2011 and Jan.-Feb.2010
1. Sales Growth of Seat Buses in the Bus Industry
Table 3: Sales Growth Statistics Table of Seats Buses in various lengths for buses in Jan.-Feb.2011
|
|
Total |
12<L |
11<L≤12 |
10<L≤11 |
9<L≤10 |
|
Jan.-Feb.2011 |
22856 |
61 |
3892 |
1433 |
736 |
|
Jan.-Feb.2010 |
18831 |
79 |
3591 |
1777 |
567 |
|
year-on-year growth
|
21.4 |
-22.8 |
8.4 |
-19.4 |
29.8 |
|
8<L≤9 |
7<L≤8 |
6<L≤7 |
5<L≤6 |
3.5<L≤5 |
|
|
Jan.-Feb.2011 |
2264 |
2939 |
2915 |
2372 |
6244 |
|
Jan.-Feb.2010 |
2450 |
3436 |
3104 |
2450 |
1377 |
|
year-on-year growth
|
-7.6 |
-14.5 |
-6.1 |
-3.2 |
353.4 |
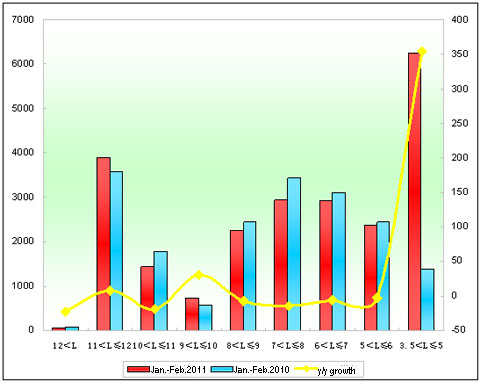
Chart 3: Sales Growth Statistics Table of Seats Buses in various lengths for buses in Jan.-Feb. 2011
Shown above,
The sales goes up 21.4% for seat buses in Jan.-Feb.2011. In lengths, it only reduces in extra large, 8-9m,7-8m,5-6m and 6-7m while all increase in other lengths (the biggest growth showing at 3.5-5 meter while the smallest at 11-12 meter). It indicates that the sales increasing of seat buses is the main factor for the growth of the general bus market in the two month in 2011.
Source : www.chinabuses.org
Editor : Andrea
Views:4497


