Sales Analysis of China Buses in Functions in 2010
14 February 2011
Table One: Sales of coaches in 2010 (unit)
|
Coaches |
12<L |
11<L≤12 |
10<L≤11 |
9<L≤10 |
8<L≤9 |
|
2010.10 |
23 |
1594 |
813 |
274 |
1030 |
|
2010.11 |
31 |
1989 |
1003 |
703 |
1374 |
|
2010.12 |
71 |
3662 |
1578 |
598 |
2258 |
|
Coaches |
7<L≤8 |
6<L≤7 |
5<L≤6 |
3.5<L≤5 |
|
|
2010.10 |
1639 |
1910 |
2228 |
1303 |
|
|
2010.11 |
2281 |
2809 |
2283 |
2104 |
|
|
2010.12 |
2581 |
2789 |
2202 |
869 |
|
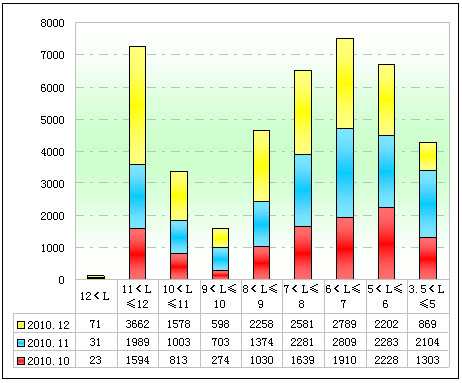
Figure one: Sales of coaches in 2010 (unit)
Table Two: Sales of city buses in 2010 (unit)
|
City Buses |
12<L |
11<L≤12 |
10<L≤11 |
9<L≤10 |
8<L≤9 |
|
2010.10 |
39 |
1080 |
1377 |
624 |
860 |
|
2010.11 |
80 |
1314 |
2086 |
625 |
624 |
|
2010.12 |
110 |
2116 |
1569 |
1173 |
978 |
|
City Buses |
7<L≤8 |
6<L≤7 |
5<L≤6 |
3.5<L≤5 |
|
|
2010.10 |
794 |
166 |
141 |
110 |
|
|
2010.11 |
1302 |
186 |
163 |
87 |
|
|
2010.12 |
1346 |
395 |
245 |
100 |
|
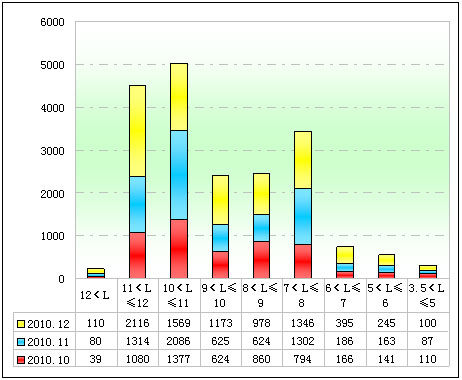
Figure Two: Sales of city buses in 2010 (unit)
Table Three: Sales of sleeper buses in 2010 (unit)
|
Sleeper Buses |
12<L |
11<L≤12 |
10<L≤11 |
|
2010.10 |
11 |
236 |
0 |
|
2010.11 |
24 |
397 |
3 |
|
2010.12 |
54 |
765 |
0 |
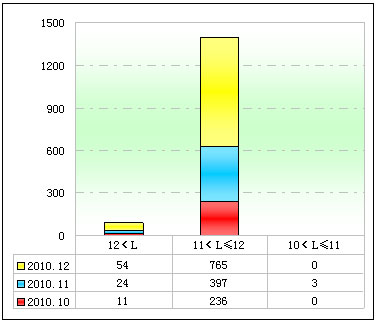
Figure Three: Sales of sleeper buses in 2010 (unit)
Source : www.chinabuses.org
Editor : Mika
Views:3745


