Analysis of Sales Data of King Long Bus in Jan.-Nov. 2010 Ⅱ
24 December 2010
2. King Long Seat Buses
Table 4: Sales Growth Statistics Table of King Long Seat Buses in various lengths for buses in Jan.-Nov. 2010
|
Total |
12<L |
11<L≤12 |
10<L≤11 |
9<L≤10 |
|
|
Jan.-Nov.2010 |
17630 |
8 |
3131 |
1605 |
394 |
|
Jan.-Nov.2009 |
9761 |
79 |
1879 |
896 |
552 |
|
Year-on-year growth
|
83.3 |
-89.9 |
66.6 |
79.1 |
-28.6 |
|
Industry growth |
40.9 |
-49.3 |
77.4 |
43 |
1.4 |
|
8<L≤9 |
7<L≤8 |
6<L≤7 |
5<L≤6 |
|
|
|
Jan.-Nov.2010 |
1849 |
1061 |
532 |
9050 |
|
|
Jan.-Nov.2009 |
1366 |
1489 |
0 |
3500 |
|
|
Year-on-year growth
|
35.6 |
-28.7 |
100 |
158.6 |
|
|
Industry growth |
46.7 |
16.6 |
1.2 |
132.9 |
|
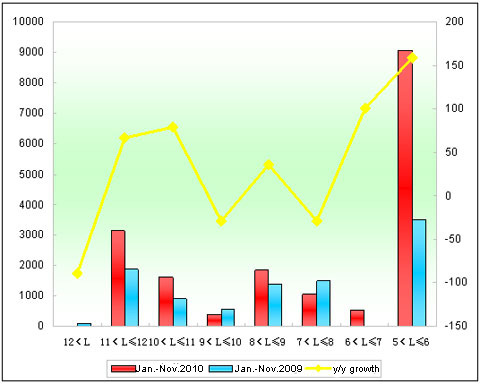
Chart 4: Sales Growth Statistics Chart of King Long Seat Buses in various lengths for buses in Jan.-Nov. 2010
Shown above,
① The sales of King Long Bus seat buses increases 83.3%, almost 42 percentage higher than the growth rate of the general bus market in Jan.-Nov.2010. It indicates that the growth of King Long seat buses is the main factor for that of King Long Bus.
②The growth of King Long 11-12 meter seat buses reaches 66.6% in Jan.-Nov.2010 while 11 percentage less than in the industry; 8-9 meter reaches 35.6% while almost 11 percentage less than in the industry. However, it increases 5550 5-6 meter buses. It indicates that the sales of 5-6 meter buses lead to its main growth during this period of time.
Analysis of Sales Growth of City Buses in Various Lengths in Jan.-Nov.2010 and Jan.-Nov.2009
1. The Sales Growth of City Buses in Various Lengths for the Bus Industry
Table 5: Sales Growth Statistics Table of City Buses in various lengths for buses in Jan.-Nov.2010 and Jan.-Nov.2009
|
|
Total |
12<L |
11<L≤12 |
10<L≤11 |
9<L≤10 |
|
Jan.-Nov.2010 |
54270 |
869 |
12910 |
12462 |
6426 |
|
Jan.-Nov.2009 |
46338 |
1045 |
9783 |
11052 |
6579 |
|
Year-on-year growth |
17.1 |
-16.8 |
32 |
12.8 |
-2.3 |
|
8<L≤9 |
7<L≤8 |
6<L≤7 |
5<L≤6 |
|
|
|
Jan.-Nov.2010 |
8296 |
8706 |
2127 |
1721 |
|
|
Jan.-Nov.2009 |
7647 |
6929 |
2999 |
304 |
|
|
Year-on-year growth |
8.5 |
25.6 |
-29.1 |
466.1 |
|
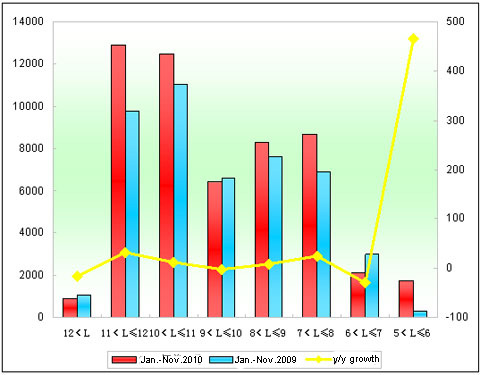
Chart 5: Sales Growth Statistics Chart of City Buses in various lengths for buses in Jan.-Nov.2010
Shown above,
The sales of city buses increases 17.1% in Jan.-Nov.2010. In lengths, the sales of buses at all lengths show positive growth, apart from 6-7 meter,9-10 meter and extra large buses,in particular, 5-6 meter buses (466.1% growth), which indicate the great potential of rural city bus market and 11-12m city buses.
2. King Long City Buses
Table 6: Sales Growth Statistics Table of King Long City Buses in various lengths for buses in Jan.-Nov. 2010
|
|
Total |
12<L |
11<L≤12 |
10<L≤11 |
|
Jan.-Nov.2010 |
3315 |
44 |
737 |
1196 |
|
Jan.-Nov.2009 |
2759 |
0 |
1673 |
649 |
|
Year-on-year growth
|
20.2 |
100 |
-55.9 |
84.3 |
|
Industrial Growth |
17.1 |
-16.8 |
32 |
12.8 |
|
9<L≤10 |
8<L≤9 |
7<L≤8 |
|
|
|
Jan.-Nov.2010 |
250 |
714 |
374 |
|
|
Jan.-Nov.2009 |
0 |
437 |
2759 |
|
|
Year-on-year growth
|
100 |
63.4 |
-86.4 |
|
|
Industrial Growth |
-2.3 |
8.5 |
25.6 |
|
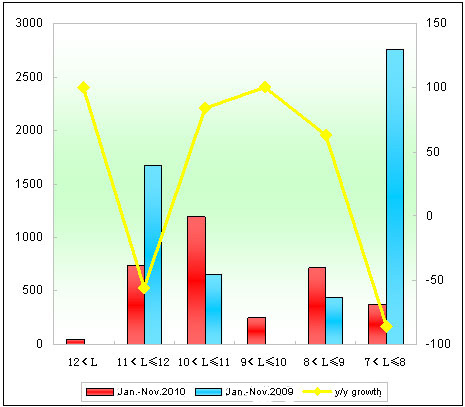
Chart 6: Sales Growth Statistics Chart of King Long City Buses in various lengths for buses in Jan.-Nov. 2010
Shown above,
① The sales of King Long city buses increases 20.2% while 17.1% in the industry in the first eleven months in 2010. The main growth shows at 10-11 meter, 8-9 meter and main decreasing shows at 11-12 meter (936 units less) and 7-8 meter (2385 units less).
② The sales of King Long extra large city buses increases 44 units while zero in Jan.-Oct.2009; negative growth in the industry.
Source : www.chinabuses.org
Editor : Andrea
Views:4579


