Analysis of Sales Data of King Long Bus in Jan.-Oct. 2010 Ⅱ
09 December 2010
2. King Long Seat Buses
Table 4: Sales Growth Statistics Table of King Long Seat Buses in various lengths for buses in Jan.-Oct. 2010
|
|
Total |
12<L |
11<L≤12 |
10<L≤11 |
9<L≤10 |
|
Jan.-Oct.2010 |
16007 |
1 |
2908 |
1456 |
322 |
|
Jan.-Oct.2009 |
8569 |
44 |
1725 |
797 |
508 |
|
Year-on-year growth
|
86.8 |
-97.7 |
68.58 |
82.7 |
-36.6 |
|
Industry growth |
46.5 |
-45.5 |
82.8 |
46.8 |
-3.4 |
|
8<L≤9 |
7<L≤8 |
6<L≤7 |
5<L≤6 |
|
|
|
Jan.-Oct.2010 |
1712 |
977 |
510 |
8121 |
|
|
Jan.-Oct.2009 |
1233 |
1318 |
0 |
2944 |
|
|
Year-on-year growth
|
38.8 |
-25.9 |
100 |
175.8 |
|
|
Industry growth |
49.6 |
21.5 |
13.3 |
135.4 |
|
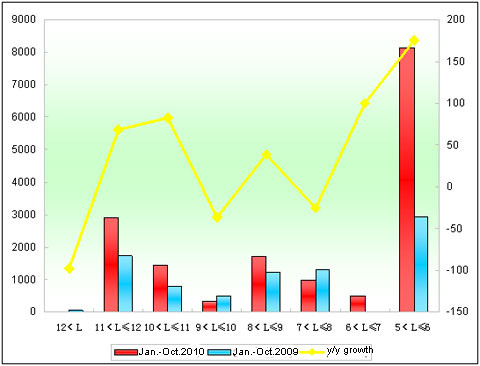
Chart 4: Sales Growth Statistics Chart of King Long Seat Buses in various lengths for buses in Jan.-Sep. 2010
Shown above,
① The sales of King Long Bus seat buses increases 86.8%, almost 42 percentage higher than the growth rate of the general bus market in Jan.-Oct.2010. It indicates that the growth of King Long seat buses is the main factor for that of King Long Bus.
②The growth of King Long 11-12 meter seat buses reaches 68.58% in Jan.-Oct.2010 while 14 percentage less than in the industry; 8-9 meter reaches 38.8% while almost 11 percentage less than in the industry. However, it increases 5177 buses (5-6 meter). It indicates that the sales of 5-6 meter buses lead to its main growth.
Analysis of Sales Growth of City Buses in Various Lengths in Jan.-Oct.2010 and Jan.-Oct.2009
1. The Sales Growth of City Buses in Various Lengths for the Bus Industry
Table 5: Sales Growth Statistics Table of City Buses in various lengths for buses in Jan.-Oct.2010 and Jan.-Oct.2009
|
|
Total |
12<L |
11<L≤12 |
10<L≤11 |
9<L≤10 |
|
Jan.-Oct.2010 |
47803 |
789 |
11596 |
10376 |
5801 |
|
Jan.-Oct.2009 |
41410 |
990 |
8610 |
9959 |
6023 |
|
Year-on-year growth
|
15.4 |
-20.3 |
34.7 |
4.2 |
-3.7 |
|
8<L≤9 |
7<L≤8 |
6<L≤7 |
5<L≤6 |
|
|
|
Jan.-Oct.2010 |
7672 |
7404 |
1941 |
1558 |
|
|
Jan.-Oct.2009 |
6788 |
5967 |
2795 |
278 |
|
|
Year-on-year growth
|
13 |
24.1 |
-30.6 |
460.4 |
|
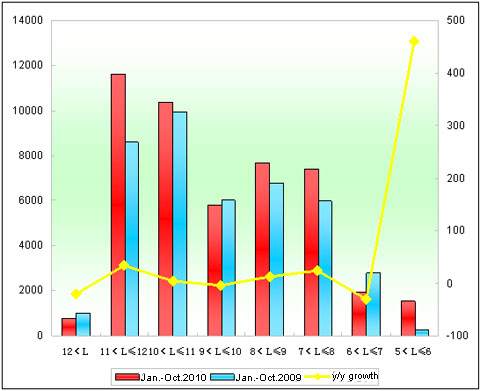
Chart 5: Sales Growth Statistics Chart of City Buses in various lengths for buses in Jan.–Oct.2010
Shown above,
The sales of city buses increases 15.4% in Jan.-Oct.2010. In lengths, the sales of buses at all lengths show positive growth, apart from 6-7 meter,9-10 meter and extra large buses,in particular, 5-6 meter buses (460.4% growth), which indicate the great potential of rural city bus market and then 11-2 city buses, which indicates the big market demand in mainstream courses in big and middle cities.
2. King Long City Buses
Table 6: Sales Growth Statistics Table of King Long City Buses in various lengths for buses in Jan.-Oct. 2010
|
|
Total |
12<L |
11<L≤12 |
10<L≤11 |
|
Jan.-Oct.2010 |
2907 |
44 |
656 |
950 |
|
Jan.-Oct.2009 |
2405 |
0 |
1336 |
638 |
|
Year-on-year growth
|
20.87 |
100 |
-50.9 |
48.9 |
|
Industry growth |
15.4 |
-20.3 |
34.7 |
4.2 |
|
9<L≤10 |
8<L≤9 |
7<L≤8 |
|
|
|
Jan.-Oct.2010 |
250 |
656 |
351 |
|
|
Jan.-Oct.2009 |
0 |
431 |
0 |
|
|
Year-on-year growth
|
100 |
52.2 |
100 |
|
|
Industry growth |
-3.7 |
13 |
24.1 |
|
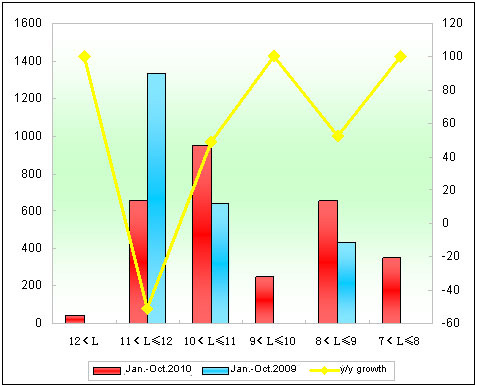
Chart 6: Sales Growth Statistics Chart of King Long City Buses in various lengths for buses in Jan.-Oct. 2010
Shown above,
① The sales of King Long city buses increases 120.87% while 15.4% in the industry in the first ten months in 2010. The main growth shows at 10-11 meter, 8-9 meter and 7-8 meter (351 units more) and main decreasing shows at 11-12 meter (680 units less).
② The sales of King Long extra large city buses increases 44 units while zero in Jan.-Oct.2009; negative growth in the industry.
Source : www.chinabuses.org
Editor : Andrea
Views:3508


