Sales Analysis of Zhengzhou Yutong Bus from Jan. to May 2010 Ⅱ
02 July 2010
www.chinabuses.org: Part 3 Sales growth of city buses in all lengths in the first five months in 2010 over 2009
1. Sales growth of city buses in all lengths
Table 5 Statistics of sales growth of city buses in all lengths
|
Total |
12<L |
11<L≤12 |
10<L≤11 |
9<L≤10 |
|
|
Jan– May 2010 |
21270 |
353 |
4672 |
4277 |
2531 |
|
Jan– May 2009 |
15438 |
418 |
2884 |
3851 |
2075 |
|
Growth |
37.8 |
-15.6 |
62 |
11.06 |
21.98 |
|
8<L≤9 |
7<L≤8 |
6<L≤7 |
5<L≤6 |
3.5<L≤5 |
|
|
Jan– May 2010 |
3731 |
3493 |
1052 |
830 |
331 |
|
Jan– May 2009 |
2670 |
2262 |
1112 |
166 |
0 |
|
Growth |
39.74 |
54.42 |
-5.4 |
400 |
100 |
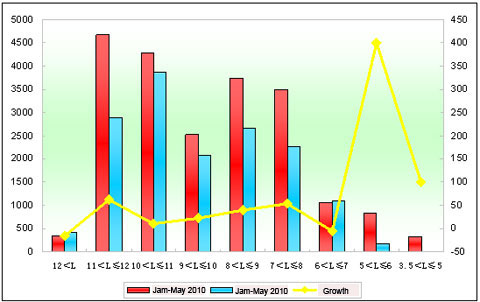
Figure 5 Statistics of sales growth of city buses in all lengths
It can be seen from above that sales of city buses increased 37.8% in the first five months, nearly 7% less than that of the first four months. As to lengths, only sales of 6-7m and super large buses decreased. And biggest growth was 5-6m, and then it comes to 11-12m, 7-8m, showing that sales growth of 5-6m countryside buses and 11-12m super large buses are the main factor for the growth of bus sales.
2. Zherngzhou Yutong city buses
Table 6 Statistics of Yutong city buses sales growth in all lengths in the first five months
|
Total |
12<L |
11<L≤12 |
10<L≤11 |
|
|
Jan– May 2010 |
2609 |
60 |
884 |
325 |
|
Jan– May 2009 |
1713 |
89 |
562 |
140 |
|
Growth
|
52.3 |
-32.58 |
57.3 |
132.1 |
|
Growth in industry |
37.8 |
-15.6 |
62 |
11.06 |
|
9<L≤10 |
8<L≤9 |
7<L≤8 |
|
|
|
Jan– May 2010 |
297 |
535 |
508 |
|
|
Jan– May 2009 |
257 |
351 |
314 |
|
|
Growth
|
15.56 |
52.4 |
61.78 |
|
|
Growth in industry |
21.98 |
39.74 |
54.42 |
|
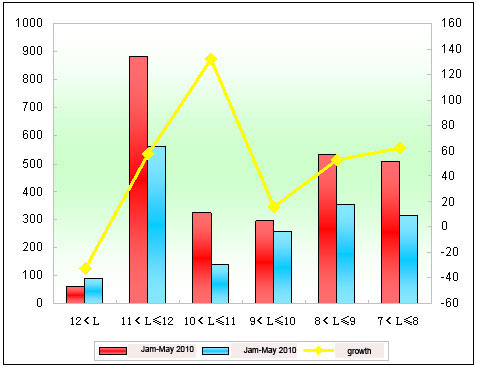
Figure 6 Statistics of Yutong city buses sales growth in all lengths in the first five months
It can be seen from above that:
1. Sales of Yutong city buses increased 52.3%, 19% higher than that of the first four months, and the figure for bus industry was 37.8%, showing that sales of Yutong city buses increased and this is also the main factor to drive overall growth of Yutong buses sales.
2. 332 Yutong 11-12m city buses were sold out, up 57.3%, nearly 3% less than that of average bus industry; while sales of super large buses decreased 32.58%.
3. Sales of 7-8m, 8-9m, 9-10m and 10-11m city buses were all increasing, all higher than that of average, especially sales growth of 10-11m buses were 132.1%.
Part 4 Sales growth of Yutong sleeper buses in all lengths in the first five months in 2010 over 2009
1. Sales growth of Yutong sleeper buses in all lengths
Table 7 Statistics of sales growth of Yutong sleeper buses in all lengths in the first five months
|
Total |
12<L |
11<L≤12 |
10<L≤11 |
8<L≤9 |
|
|
Jan– May 2010 |
1392 |
72 |
1236 |
11 |
73 |
|
Jan– May 2009 |
916 |
116 |
796 |
4 |
0 |
|
Growth |
51.9 |
-37.9 |
55.3 |
175 |
100 |
It can be seen from above that:
Sales of sleeper buses were increasing in the first five months over 2009, up 51.9%, 18% less than that of the first four months, 68.9%. And 11-12m sleeper buses increased the most. We can also find that sales of sleeper buses were less than coaches, but higher than city buses.
2. Zhengzhou Yutong sleeper bus
Table 8 Statistics of sales growth of Yutong sleeper buses in the first five months 2010
|
Total |
12<L |
11<L≤12 |
|
|
Jan– May 2010 |
687 |
19 |
668 |
|
Jan– May 2009 |
489 |
21 |
468 |
|
Growth
|
40.5 |
-9.52 |
42.74 |
|
Growth in Industry |
51.9 |
-37.9 |
55.3 |
It can be seen from above that:
1. Yutong sleeper bus is in monopoly in the markets, and 1,392 sleeper buses were sold out, 687 of them were sold by Yutong, taking 49.35% market share, up 1.21% than the previous 48.14%. We can see that its monopoly in sleeper bus markets are strengthening.
2. Sales of Yutong sleeper buses were mainly 11-12m, medium buses have been eliminated, and there were 19 12m above sleeper buses were sold out, down 9.52% than previous year.
Source : www.chinabuses.org
Editor : Eric
Views:4815


